Teaching Physics with the Physics Suite Edward F. Redish Home | Action Research Kit| Sample Problems | Resources | Product Information
Problems Sorted by Type | Problems Sorted by Subject | Problems Sorted by Chapter in UP
 |
Teaching Physics with the Physics Suite Edward F. Redish Home | Action Research Kit| Sample Problems | Resources | Product Information
|
Problems Sorted by Type | Problems Sorted by Subject | Problems Sorted by Chapter in UP |
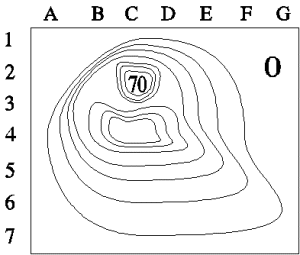
| 1. (a) The figure on the right shows a contour plot of a piece of a range of hills in Virginia. The outer part of the figure is at sea level (marked 0). Each contour line from the region marked zero shows a level 10 m higher than the previous. The maximum height is 70 m and is shown by the number 70.
Answer the following questions by giving the pair of grid markers (a letter and a number) closest to the point being requested.
(b) Now suppose the figure represents instead a plot of the electric equipotentials for the surface of a glass plate. The numbers now represent voltage. The maximum is 70 V and each contour line from the region marked zero shows a level 10 V higher than the previous.
|  |
Not finding what you wanted? Check the Site Map for more information.
Page last modified October 15, 2002: E04