I have been keeping statistics of the cases and deaths,
and being a physicist who is used to looking at data and doing fits, I'm presenting what I see.
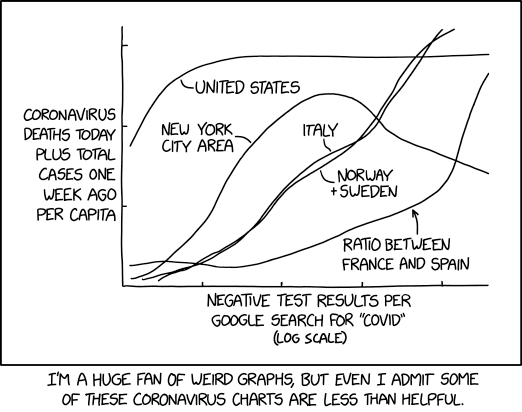
First, it's always good to make plots and see what's what. But then,
it's pretty easy to make plots that have information but are useless,
something wonderfully communicated by XKCD!
Below you will see all the places (continents, nations, states, counties) that I have data for.
All data comes from the COVID-19 Data Repository
by the Center for Systems Science and Engineering (CSSE) at Johns Hopkins.
Files for
US cases,
US deaths,
Global cases, and
Global deaths
can all be found linked from
here.
This is version and we are using UMD_plot version .
To start, push the button "Fetch ALL data". This fetches all of the data files automatically from the
JHU web site.
Once all the data has been downloaded, you will be notified that all is DONE! (next to the fetch
button), and the program will print out the first and last dates for the files. Hopefully all files will have
the same dates, but if not, you will be notified, and then complain to Drew Baden.
The places are grouped according to region, nation, state, as appropriate. You access each one via the
black triangle, which expands and let's you see what's underneath. Click on the name (it's a button)
to show the plot.
You will see on the left the "tree" starting with the 5 continents (Asia and Australia combined).
If you click on the black triangle, it will expand into countries that have data for that continent. Any country that
has data for states/provinces will have a triangle you can click on the expand (not too many, mostly China,
Canada, France, and Australia). For the US, you can expand any state and see the counties.
To plot data, just click on the button for the place. The border will turn dark blue if it's being plotted.
This allows you to unexpand and go to another place so you can overlay plots from more than one place at a time.
If you don't want to plot the data per 1M population, uncheck the "Normalize to population?" checkbox.
There are two controls you will have access to for each element (region, nation, state, county):
color of the data plotted (default is blue); and
selecting which data to plot (cases, deaths, raw, or average over 7 days, default is average cases).
You can also type out onto the browser window in a "textarea" (try it, you'll see) the raw or averaged data
for cases and deaths. To access the 2 controls or the type-out capability, just right click on the
element to bring up the controls. You will see the 2 controls and the buttons for printout, and the population
for the element. Right click again to make them hidden.
If you are using this on an iPhone or iPad, instead of right clicking you will see a small
small yellow button with the label ℂ. Clicking on this will bring up the same controls window, and
clicking again will hide it.
In the plot, you can change the X and Y axis limits:
o Clicking on the x-axis labels and drag left of the
midpoint to change the minimum x-value, right to change the maximum x-value. Double click anywhere on the x-axis
labels to reset to default minimum and maximum.
o For the Y-axis, click and drag on the y-axis labels, drag up or down changes the y maximum value.
Also, mousing over the data will show you the data values.
For experts, hit this button to
type out the region objects to the console.
instructions on how to
fetch and plot data.
Normalize to 100k population?
Default data to plot:
Cases
Ave Cases
Deaths
Ave Deaths
To make plots:
• After pushing the "Fetch All data" button above, push this
button to show a predetermined set of plots, or...
• Select places of interest by clicking on the triangles and expanding below (see above "Show"
button for help).
Push this button to .
Standard plots:
:BC CA NY ME UK Israel
:US UK Fr
:BC MontCo Maine
:MontCo PG DC Fairfax
All rights reserved. No part of this publication may be reproduced, distributed, or transmitted in any
form or by any means, including photocopying, recording, or other electronic or mechanical methods, without
the prior written permission of the publisher, except in the case of brief quotations embodied in critical
reviews and certain other noncommercial uses permitted by copyright law.