University of Maryland Physics Education Research Group
 |
Physics Software from the UMd PERG:
Conductor -- Moving Charges Simulation |
I. D. Johnston, University of Sydney
Download File (35 KB)
Brief description
This program allows you to draw a closed curved representing the volume of a conductor and place charges through the volume. Options in the program allow the user to "release" the charges, letting them move freely in the conductor's volume as a result of the forces they feel from the other charges. Each charge has an arrow attached showing the direction of the net electrical force it feels. Other options permit the display of the electric field in the region.
Pedagogical utility
The program allows the student to see why charges in a conductor seek the surface, despite the fact that they could be farther apart if they distributed themselves throughout the volume. It also helps one understand why the electric field is normal to the surface of a conductor and vanishes inside the conductor's volume. One can easily construct surfaces with points and see that charge and high electric fields build up at points, often high enough to spray the charge off the conductor.
Appropriate for
- High school AP physics
- Introductory algebra-based physics
- Introductory calculus-based physics
- Specialized classes on electricity
Screen views
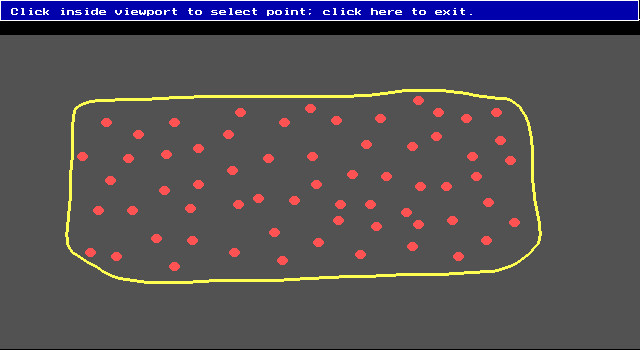
Fig. 1: Display of a volume with charges distributed through it.
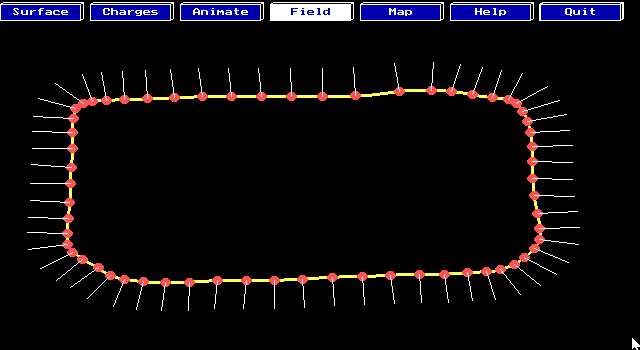
Fig 2: The end result of the animation of figure 1.
Availability
The code may be downloaded by clicking here.
(35K)
The file is a zip file. Unpack it using WinZip.
You will then find the following files in your directory:
- egavga.bgi (6K) -- the graphics driver for the file
- conductor.exe (78K) -- The main executable
If you are running under Windows, be certain the computer knows where the file is and what directory it is in. To check this, right click on the program icon and choose "Properties." On the tab "program" make sure the full address of the program is correct. The "start-up directory" should be the directory containing the program.
Technical information
Since the situation is actually two dimensional, forces are set to be appropriate for a Coulomb force in a 2-space, that is, the forces fall as 1/r rather than as 1/r2. The white vectors shown while animating are directional only and do not give an indication of the size of the force. The equilibrium situation may not be reached for a long time, since once the charges reach the surface, they only move according to the component of the force they feel parallel to surface and this may be small.
Program help
The menu items on the menu you see first (the main menu) do the following things:
- SURFACE :
- Allows you to draw a volume (closed curve) using the mouse.
- CHARGES:
- Allows you to place charges with a click of the mouse.
- ANIMATE:
- Allows the charges to move in response to the electric forces they feel from the other charges.
- FIELD:
- Allows you to measure the electric field at any point.
- MAP:
- Displays the electric field on a grid using colored unit lines. Red is strong, violet (and gray) are weak.
- HELP:
- Gives a brief description of the menu items.
- QUIT:
- Ends the program.
Select SURFACE and click once anywhere inside the black region. You can then draw any curve representing the volume of a conductor. The surface will close when your mouse comes within a few pixels of your starting point. Select CHARGE and click anywhere inside your closed curve. Red circles will appear representing charges. When you are finished distributing charges, press ANIMATE. The charges will move according to the electric forces they feel. A white line is attached to each charge showing the direction of the force on that charge. The charges may not leave the closed curve and are stopped at the boundary. The boundary provides whatever normal force is necessary to keep them in. The charges may continue to move along the boundary if the electric force they feel is not normal to the boundary.
You may measure the electric field at any point by choosing FIELD and clicking at the desired point. A small short line is dropped at that point representing a field vector, its color indicating the strength of the field. The color scale is spectral with red being the strongest, followed by orange, yellow, green, blue, violet, and gray (the weakest).
If you choose MAP, colored field vectors are arrayed on a grid.
It is particularly interesting to note what happens at corners and points.
Contact person
E. F. Redish,
University of Maryland,
College Park, MD 20742;
phone: 301-405-6120,
fax: 301-314-9531,
e-mail: redish@physics.umd.edu