On the Effectiveness of Active-Engagement
Microcomputer-Based Laboratories: Part 2
Edward F. Redish, Jeffery M. Saul, and Richard N. Steinberg
Department of Physics, University of Maryland, College Park, MD 20742
Click here to return to part 1.
EVALUATION TOOLS
In order to evaluate the success of our interventions, we must decide what we mean by "success". This will play an important role in determining our approach to evaluation. What we mean by success is, in turn, determined by our model of student understanding and learning.[15] The critical element of this model for our application is that a student may "have" an item of knowledge, that is, be able to recall it in response to a narrow range of triggers, but be unable to recall and apply it in a wide range of appropriate circumstances. We want our evaluations to test for robust functional understanding.
Four plausible and frequently used approaches to evaluation are:
- Measure student and faculty satisfaction with a survey or questionnaire.
- Measure student learning using a multiple-choice test designed using the results of physics education research on commonly found errors to specify attractive distractors.
- Measure student learning using long-answer exam questions -- problems or open-expression questions in which students explain and discuss their answers.
- Measure student learning through recorded problem interviews.
The first approach is the simplest and most commonly used, but although both student and faculty satisfaction is important in motivating student work, and presumably therefore student success, the link between satisfaction and learning is highly indirect. Indeed, students whose primary goal is a good grade may find higher satisfaction in a course that produces a good grade without improved learning, since improved learning often requires time and painful effort. We do not expect this measure to correlate well with functional understanding.
The second approach is easy to deliver, but requires a substantial effort to develop. The results can be highly suggestive, but multiple choice tests can be difficult to interpret. They have a tendency to overestimate the student's learning since they can sometimes be answered correctly by means of incorrect reasoning[16] or by "triggered" responses that fail to represent functional understanding. On the other hand, the use of common misconceptions as distractors produces "attractive nuisances" that challenges the students' understanding. Students that get the correct answer despite this challenge are likely to having a good understanding of the topic in question. We expect therefore that this approach does give some indication of the robustness of a student's possession of and confidence in a correct answer.
The third approach is easy to deliver, but the analysis can be time consuming. Student answers must be read in detail and classified by the understanding displayed. The functionality of student knowledge is rather well-tested by this approach since the student is being asked to produce the desired knowledge within the context of a problem and without the most common and automatic triggers. It has the defect that students occasionally give answers too incomplete or ambiguous to let us see what they are thinking.
The fourth approach is the most effective since it permits the researcher to observe in detail the functionality of the student's knowledge by the presentation of a variety of contexts. The researcher can follow up suggestive responses with more detailed and individually designed questions, but it is highly time consuming. In addition to the recording time (usually one or more hours per student), the recordings must be transcribed and analyzed. This approach is thus impractical for evaluating the distribution of student knowledge throughout a large class.
We have therefore chosen to combine the second and third approaches. We use as our primary evaluation tool the multiple-choice velocity questions (VQ) from Thornton and Sokoloff and the Force Concept Inventory (FCI) of Hestenes et al.[17] We supplement these with a long-answer examination question to provide a probe of the functionality of the students' knowledge in a more complex context.In order to permit a comparison of our students with other classes and to test their understanding of Newton's third law, we used the FCI. This is a set of 29 qualitative multiple choice questions on mechanics. Our personal experience with individual students is consistent with Hestenes's claim that success in this test correlates with a good understanding of Newtonian mechanics as measured by detailed interviews. We gave the FCI both as a pre-test in the first week of the class and as a post-test in the last week of the class. This permits us to get a general overview of both the students' preparation in mechanics and the overall effect of the course.
A detailed study of FCI results nationwide by Hake[18] compares the performance of a large number of classes on the FCI. Hake's results show an interesting uniformity. When the class's gain on the FCI (post-test average - pre-test average) is plotted against the class's pre-test score, classes of similar structure lie approximately along a straight line passing through the point (100,0). This is shown schematically in Fig. 2.
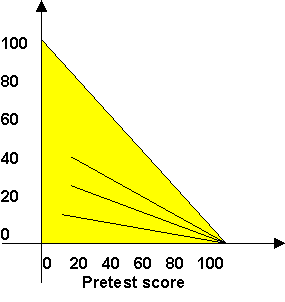
Fig. 2: Schematic of the Hake plot. A class's average pre-test FCI score is plotted as the abscissa, the pre- to post-test gain as the ordinate. Since the maximum average is 100%, every data point must lie in the shaded region. The lines of constant h are shown for a few values of h.
Traditional classes lie on the line closest to the horizontal axis and show limited improvement. The middle line represents classes with active engagement. The steepest line represents classes with active engagement and a research-based text. The negative slope of the line from a data point to the point (100,0) is a figure of merit:
h = (class post-test average - class pre-test average)/(100 - class pre-test average)
The interpretation of this is that two classes having the same figure of merit, h, have achieved the same fraction of the possible gain.
The FCI contains a well-defined set of four questions that deal with Newton's third law. (They are given in the Appendix.) In order to evaluate the overall effect of the course, we calculate the figure of merit for the class's average on this set of questions. Since at present no data has been presented to suggest that a result similar to Hake's might hold for a sub-cluster of the FCI, we present both the absolute results and the fraction of the possible gain.
Two lecture classes taught by the same professor were tested with the VQ. Ten lecture classes run by six lecturers were tested with the FCI. The situations are summarized in Table 1.
Table 1: Lecture Classes Tested
| Class | N(a) | Class Structure | FCI pre | FCI post | h |
|---|
| A1 | 100 | recitation(b) | | | |
| A2 | 38 | tutorial (no MBL)(c) | 47.8 | 66.7 | 0.36 |
| A3 | 109 | tutorial | 54.5 | 72.8 | 0.40 |
| B1 | 27 | recitation | 51.2 | 65.5 | 0.29 |
| B2 | 19 | recitation | 58.8 | 69.1 | 0.25 |
| C1 | 35 | recitation | 41.8 | 54.2 | 0.21 |
| C2 | 18 | recitation | 38.3 | 47.5 | 0.15 |
| D1 | 69 | tutorial | 50.3 | 67.5 | 0.35 |
| D2 | 48 | tutorial | 44.4 | 61.9 | 0.31 |
| E | 42 | recitation | 55.4 | 55.9 | 0.01 |
| F | 55 | tutorial | 53.9 | 67.8 | 0.30 |
(a) In classes in which the FCI was given N is the number of students taking both the pre and post tests.
(b) In this class, only the VQ were given. The FCI was not done.
(c) In this class, tutorials were done, but the velocity and Newton-3 MBL tutorials were not given.
Each of the letters A to F specifies a particular instructor. When an instructor participated in the study in more than one semester, a number is assigned as well to allow us to specify a particular data set. Here and in the remainder of the tables, the rows corresponding to classes that received instruction using MBL are highlighted using bold.
The long-answer final exam question was constructed to require students to both construct a velocity graph describing a complex situation and to use Newton's third law appropriately. The question is shown in Figure 3. It was administered to one traditional lecture section (B2: N=50) and one tutorial lecture class (D2: N=82).[19] Although the content covered in this question clearly matches what all the students had been taught, it is both challenging and different than what was seen during the semester. Note that students were asked to explain their reasoning as part of their answers.
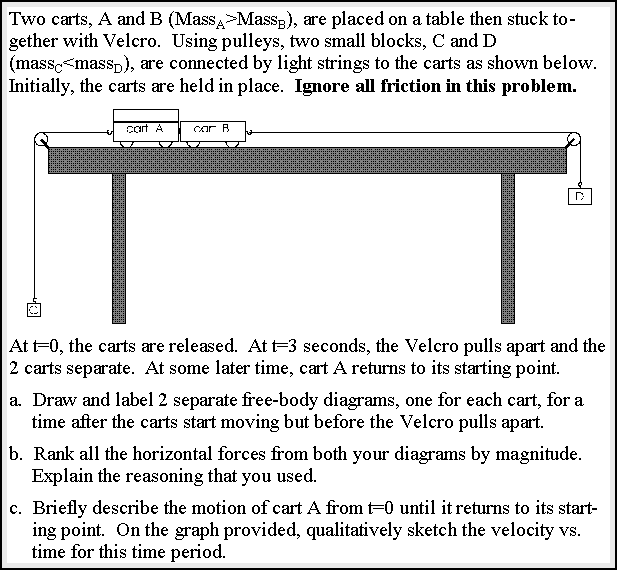
Fig 3: Long-problem exam question requiring both construction of a velocity graph and application of Newton's third law.
Click here to continue with part 3.
Endnotes:
[15] Redish, Edward F., "Implications of cognitive studies for teaching physics", Am. J. Phys. 62 (1994) 796-803.
[16] Sandin, T. R., "On not choosing multiple choice", Am. J. Phys. 53 (1985) 299-300.
[17] Hestenes, D., M. Wells, and G. Swackhammer, "Force Concept Inventory", The Physics Teacher 30:3 (1992) 141-158.
[18] Hake, R. R., "A five-thousand-student survey of mechanics test data for introductory physics courses", Indiana University pre-print, April 1996, to be published.
[19] The numbers of students completing the final exam was greater than the number of students completing both the pre-and post FCI tests which were given in lecture.
To return to part 2 of this paper, click here.
To go to part 3 of this paper, click here.
RETURNS
| University of Maryland | Physics Department | PERG UMD |
|---|
 |  |  |
This page prepared by
Edward F. Redish
Department of Physics
University of Maryland
College Park, MD 20742
Phone: (301) 405-6120
Email: redish@umd.edu
Last revision 26. July 1997.