Teaching Physics with the Physics Suite
Edward F. Redish
Home | Action Research Kit| Sample Problems | Resources | Product Information
Problems Sorted by Type | Problems Sorted by Subject | Problems Sorted by Chapter in UP
|
Teaching Physics with the Physics Suite Edward F. Redish Home | Action Research Kit| Sample Problems | Resources | Product Information | |
Problems Sorted by Type | Problems Sorted by Subject | Problems Sorted by Chapter in UP |
The PhET collection of simulations (http://phet.colorado.edu) contains many useful physics simulations. One that is very helpful in thinking about energies is Energy-Skate Park. In this simulation, you can set up a track and simulate a skateboarder rolling on the track. The starting screen of the program is shown in the figure below.
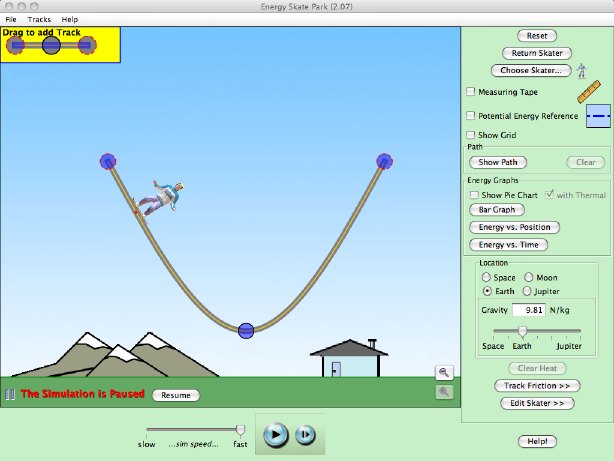
The simulation provides many tools including
Familiarize yourself with this program so you can use all the above tools to answer the questions below.
A. Set up a track for the skater that lets him run back and forth and doesn't launch him into space. Turn on the line for 0 potential energy. Run him through his paces a number of times both with and without friction and trying it with first the bar graph and then the bar graph to represent the different energies. Try it with the 0 of PE at the ground below the lowest point on the track and with it at the lowest point on the track. Which graphical representation of the energy division helps you best understand what's going on? (There is no "right" answer for this -- we just want to have you think carefully about the value of different representations for you. Different people respond differently.)
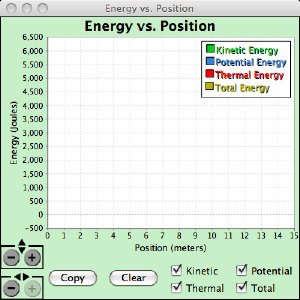
B. Is the simulation quantitatively correct? Create a simple enough situation that you can calculate the initial and final energies and compare it to the ones that are given in the graph of energy vs. time. Give your answer and make a convincing case. Some screen shots could be valuable in explaining why you decided the way you did. C. One of the graphs that we can look at is the energies as a function of position. The window for it is shown at the right. It's a bit ambiguous. Does the horizontal axis represent the x-coordinate? Or does it represent the distance that the skater has traveled along the track? Figure out a way to convincingly decide the answer to this question and describe both what the answer is and why you think so. Some screen shots could be valuable in making your case. |
 |
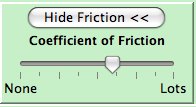
| D. Another place where the simulation is ambiguous is in the friction. If you click on the button that says "Track Friction", it changes to the slider control at the right. There are no numbers on it! From playing with the simulation quantitatively, figure out what the scale is. Determine the friction coeffecient for at least two different non-zero values of the friction so you can say whether the scale is likely to be linear or not. |
|
Page last modified October 28, 2010: PE32