Teaching Physics with the Physics Suite
Edward F. Redish
Home | Action Research Kit| Sample Problems | Resources | Product Information
Problems Sorted by Type | Problems Sorted by Subject | Problems Sorted by Chapter in UP
|
Teaching Physics with the Physics Suite Edward F. Redish Home | Action Research Kit| Sample Problems | Resources | Product Information | |
Problems Sorted by Type | Problems Sorted by Subject | Problems Sorted by Chapter in UP |
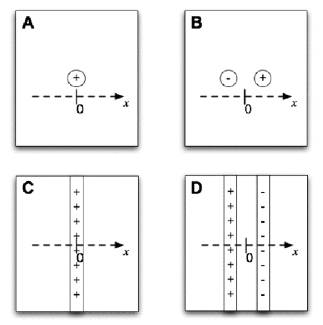
| In the figure at the right are shown four configurations of charge labelled A, B, C, and D. The small circles are meant to represent point (i.e., very small) charges and the long rectangles are meant to represent infinite (i.e., large flat) sheets of charge whose area is perpendicular to this page. Through each figure is drawn a dotted line representing the x-axis of a coordinate system with the origin indicated by 0. (The y-axis is not shown.)
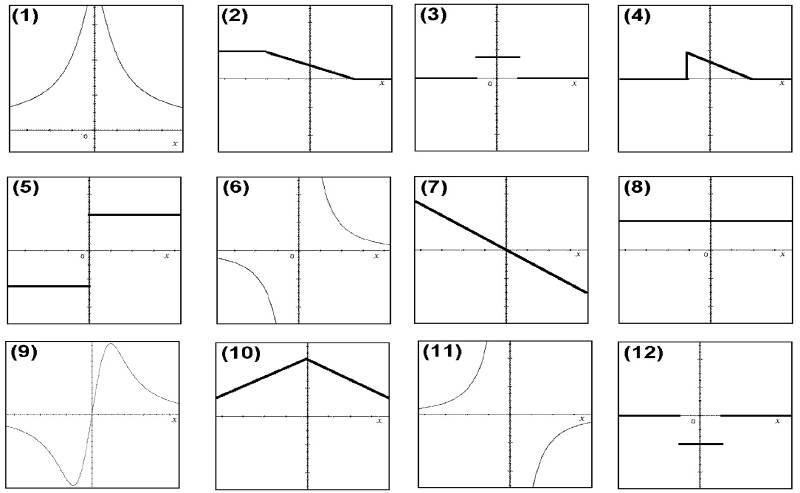
Below are shown some graphs, some of which might represent a graph of either the electrostatic potential or the x-component of the electric field at the locations along that axis in the various cases. Fill in the table below by identifying which graphs would work for each case. If more than one would work, give all that are correct. If none work, put N. |
 |
Page last modified April 9, 2009: E58