Teaching Physics with the Physics Suite
Home | Action Research Kit| Sample Problems | Resources | Product Information
Problems Sorted by Type | Problems Sorted by Subject | Problems Sorted by Chapter in UP
 |
Teaching Physics with the Physics Suite
Home | Action Research Kit| Sample Problems | Resources | Product Information |
Problems Sorted by Type | Problems Sorted by Subject | Problems Sorted by Chapter in UP |
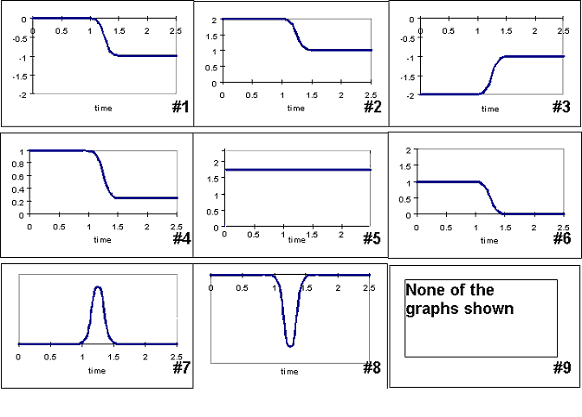
| Two identical carts labeled A and B are initially resting on an air track. The coordinate system for describing the system is shown. The cart on the right, cart B is given a push to the left and is released. The clock is then started. At t = 0, cart B moves in the direction shown with a speed v0. They hit and stick to each other. The graphs below describe some of the variables associated with the motion as a function of time. For the experiment described and for each item in the list below, identify which graph is a possible display of that variable as a function of time assuming a proper scale. "The system" refers to carts A and B together. |  |
|  |
Not finding what you wanted? Check the Site Map for more information.
Page last modified October 10, 2002: P&E12