Teaching Physics with the Physics Suite
Edward F. Redish
Problems Sorted by Type | Problems Sorted by Subject | Problems Sorted by Chapter in UP
|
Teaching Physics with the Physics Suite Edward F. Redish | |
Problems Sorted by Type | Problems Sorted by Subject | Problems Sorted by Chapter in UP |
Two pulses are started on a stretched string. An upward pulse is started on the right that moves to the left. At the same instant, a downward pulse is started on the left that moves to the right. At t = 0 their peaks are separated by a distance of 4 cm as shown below. The pulses move on the string with a speed 200 cm/s.
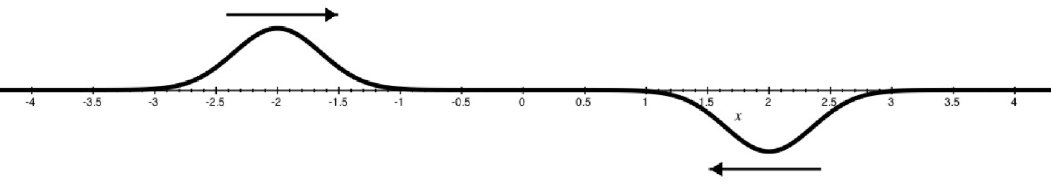
The figure below shows somegraphs that could represent properties of these pulses on the string. The vertical scales in the graphs are arbitrary and not necessarily the same. The horizontal scales all represent positions on the string (x).
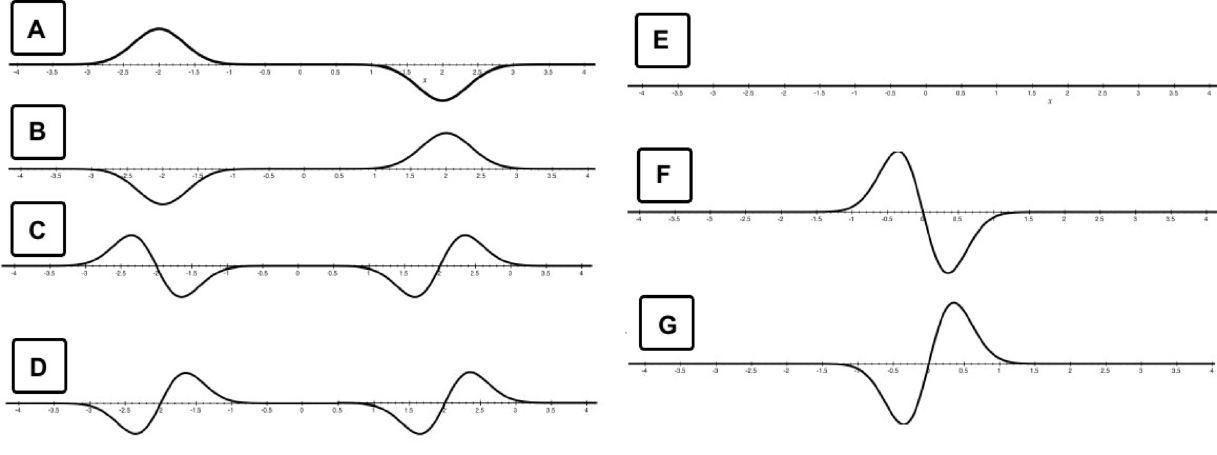
For the situation and the properties (a) - (f) below, select which graph provides the best representation of the given property. If none of the graphs are correct, write "N".
(a) Which graph best represents the appearance of the string at time t = 0.01 s?
(b) Which graph best represents the appearance of the string at a time t = 0.02 s?
(c) Which graph best represents the y-component of the velocity of the bits of the string at a time t = 0?
(d) Which graph best represents the y-component of the velocity of the bits of the string at a time t = 0.01 s?
(e) Which graph best represents the y-component of the velocity of the bits of the string at a time t = 0.02 s?
(f) Which graph best represents the x-component of the velocity of the bits of the string at a time t = 0?
Page last modified February 10, 2011: O54