Teaching Physics with the Physics Suite
Home | Action Research Kit| Sample Problems | Resources | Product Information
Problems Sorted by Type | Problems Sorted by Subject | Problems Sorted by Chapter in UP
 |
Teaching Physics with the Physics Suite
Home | Action Research Kit| Sample Problems | Resources | Product Information |
Problems Sorted by Type | Problems Sorted by Subject | Problems Sorted by Chapter in UP |
Some of the graphs shown below represent the motion of a pendulum -- a massive ball attached to a rigid, nearly massless rod, which in turn is attached to a rigid, nearly frictionless pivot.
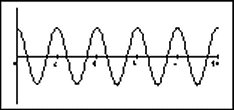
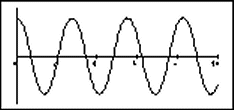
On the right below are shown four graphs of the pendulum's angle as a function of time. On the left are a set of four initial conditions and a denial. Match each graph with its most likely initial conditions (or with the denial). Note that the scales on the y axes are not necessarily the same. (There is not necessarily a one-to-one match.)
| (1) θ0 = 120o ω0
= 0
(2) θ0 = 173o ω0 = 30o/s (3) θ0 = 6o ω0 = 0 (4) θ0 = 173o ω0 = 0 (5) Not a possible pendulum graph. |
(A)  (B) (B) 
(C) |
Not finding what you wanted? Check the Site Map for more information.
Page last modified October 12, 2005: O10