June, 2019
As of Oct 1, 2019, the best version to use for the FPGA is 0x69. This version is built using the project at
C:/Users/labuser/Dropbox/PC_Stuff/Telescope/rpi_de3_vFTo check the version, start up the DE3 board and push the button labeled BUTTON1. It should read "69". If it doesn't, then either this document is out of date (if the version is higher) or the latest version needs to be downloaded (and that's another story).
Boot up the Raspberry Pi. I suggest you unplug and replug in the micro USB connector on the RPI. The last I left it, there is no monitor hooked up to it because the thing is connected to the campus ethernet and has it's own IP address, which is 129.2.92.106, and we will use the PC monitor connected to the RPI using VNC.
Log onto the PC, username is "labuser" and the password is the usual one for the lab computers. Run "VNC Viewer" and type the above IP address into the field at the top (next to "VNC Connect"). That should work ok.
When you get to the RPI window, click on the "Terminal" icon at the top. That will log you on as user pi (same password as the PC, but you won't need it for this stage). You will be in the ~pi directory. There's an alias called "runit" which points to a script called "runit". Just type the word "runit" and it will run the latest production version of the program, which is in the ~/uart subdirector. (As of today, 9/5/2019 it's de3_v9.py).
All you have to do start it is to hit the green "Start" button. Then look at the counter on the DE3 board and you should see events. Note that triggers are currently only enabled for 16 tubes (2 planes, 1 "wedge"). To change trigger conditions you will see 4 switches on the DE3 labelled SW0, SW1, SW2, SW3. I only use 2 of them, SW0 and SW1. The trigger conditions are defined by what's happening in each 8-tube plane. If there is a hit in any of the 8 tubes of each of the 2 planes, a bit is set (2 bits, 1 per plane). Let's call these OR1 and OR2 for the 2 planes 1 (top) and 2 (bottom). The trigger conditions are:
Each trigger will write data into a FIFO. If you hit "Read 1" on the program you can read the FIFO out and it will make an event display.
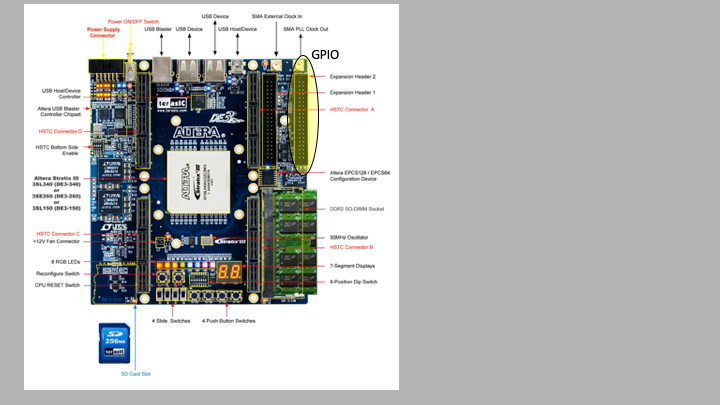
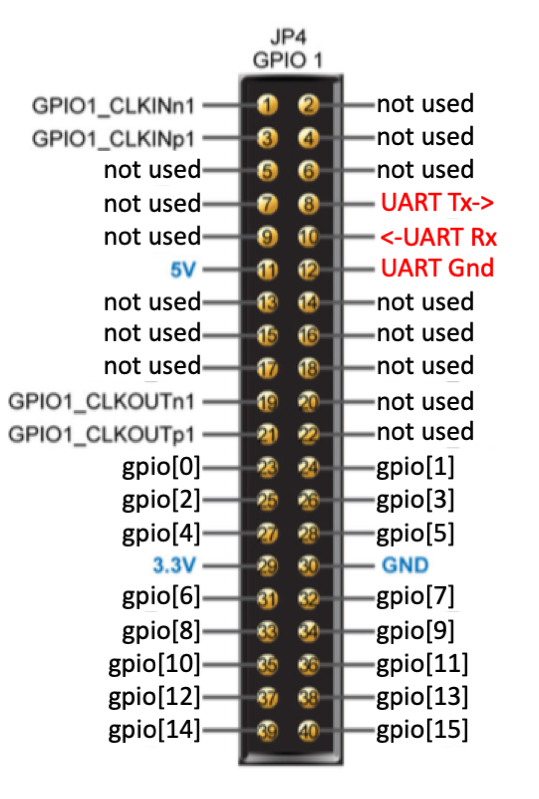
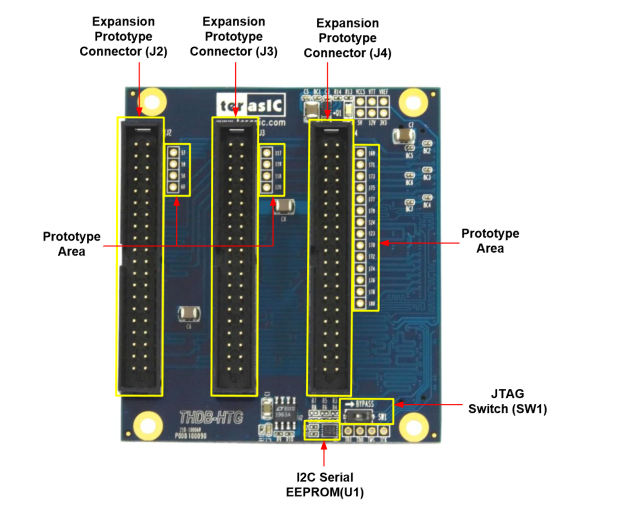
We are using J14, also known as GPIO 1, as the GPIO to connect the DE3 to the logic analyzer, and to the Raspberry PI. There are 16 pins for the logic analyzer, and they all come from the J14 40-pin connector (upper right when holding the board so that the LEDs are on the bottom) as in this diagram:
Looking at the J14 connector, we see the following assignments for the GPIO:
The GPIO pins are declared like this in the verilog:
output wire [15:0] gpioSo "gpio[15:0]" correspond to "gpio[15:0]" in the diagram. In the Quartus Assignment Editor, you can see that all of them are "3.3-V LVCMOS" IO standard. The pin assignments on the FPGA are:
| GPIO | 0 | 1 | 2 | 3 | 4 | 5 | 6 | 7 | 8 | 9 | 10 | 11 | 12 | 13 | 14 | 15 |
| FPGA Pin | AM21 | AD31 | AP20 | AD30 | AL22 | AJ20 | AM22 | AJ21 | AD21 | AP26 | AE20 | AP23 | AK24 | AE22 | AL25 | AE21 |
| GPIO1_ | D16 | D17 | D18 | D19 | D20 | D21 | D22 | D23 | D24 | D25 | D26 | D27 | D28 | D29 | D30 | D31 |
| JP14 pin | 23 | 24 | 25 | 26 | 27 | 28 | 31 | 32 | 33 | 34 | 35 | 36 | 37 | 38 | 39 | 40 |
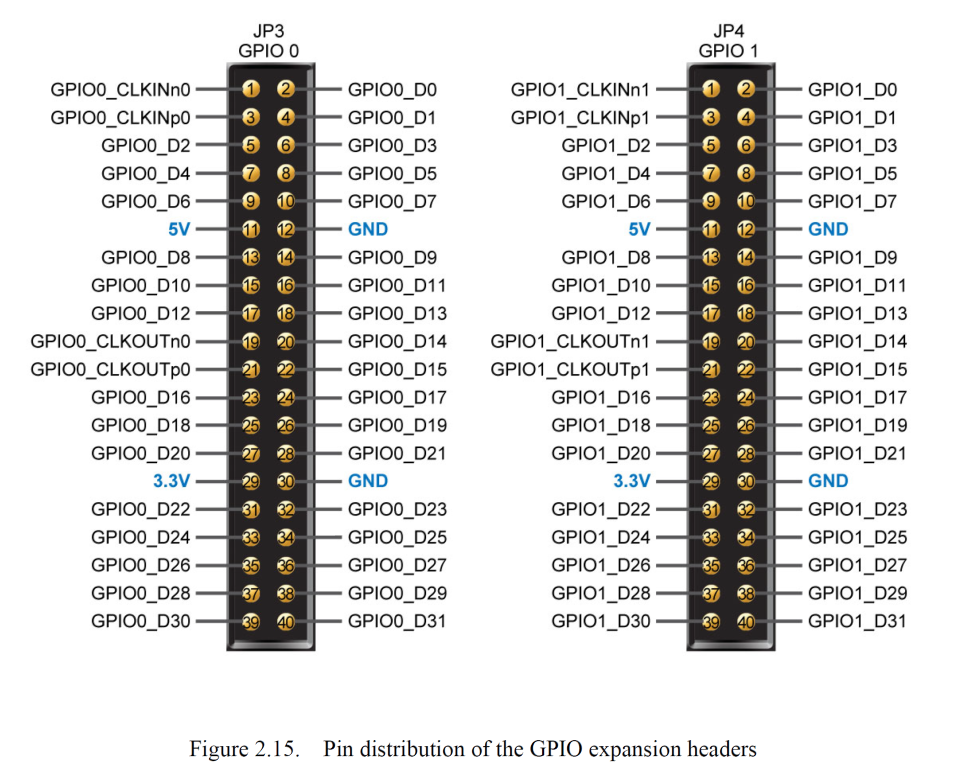
There are 2 pins on the J14 GPIO connector on the DE3 that connect it to 2 pins on the Raspberry PI for serial IO. In the table below, "TX" and "RX" are from the point of view of the DE3 (not the Raspberry PI!). Both pins are set up with 3.3-V LVCMOS IO standard. They are right next to each other. There is also a ground that goes from J14 pin 12 to the ground pin 6 on the Raspberry PI. All of this is something you can figure out if you have access to the Quartus verilog source code, Assignment Editor, and use the DE3 GPIO figure 2.15 on page 23 and table A.13 on page 92 from the DE3 User Manual.
Note that on the DE3 40-pin connector J14, pin 1 is at the top (the power switch and words "Altera" are also at the top), on the inside. For the RPI, it's the same thing, where "bottom" is where you plug in all the USB connections.
The table below tells you what pins on the DE3 J14 GPIO connector are connected to what pins on the RPI GPIO connector. Note that on the RPI, you have no choice, you have to use these pins for the UART serial connection (at least, you do if you want to use the pyserial software, which we do!). The diagram above of the J14 connect has the connection to the RPI labeled as "UART Tx->", "<-UART Rx", and "UART Gnd" in red. "Tx" and "Rx" are from the point of view of the FPGA. Note that we've defined things so that pin 8 on J14 is "Tx" and is wired to pin 8 on the RPI, which is designated "Rx" from the point of view of the RPI. Same with pin 10. The ground pins are not the same however: ground on the DE3 is pin 12 and on the RPI is pin 6. We made a 3-pin connector that can be used to connect the 2 boards together, but the connector is not symmetric (there are labels that tell you which end goes on which board).
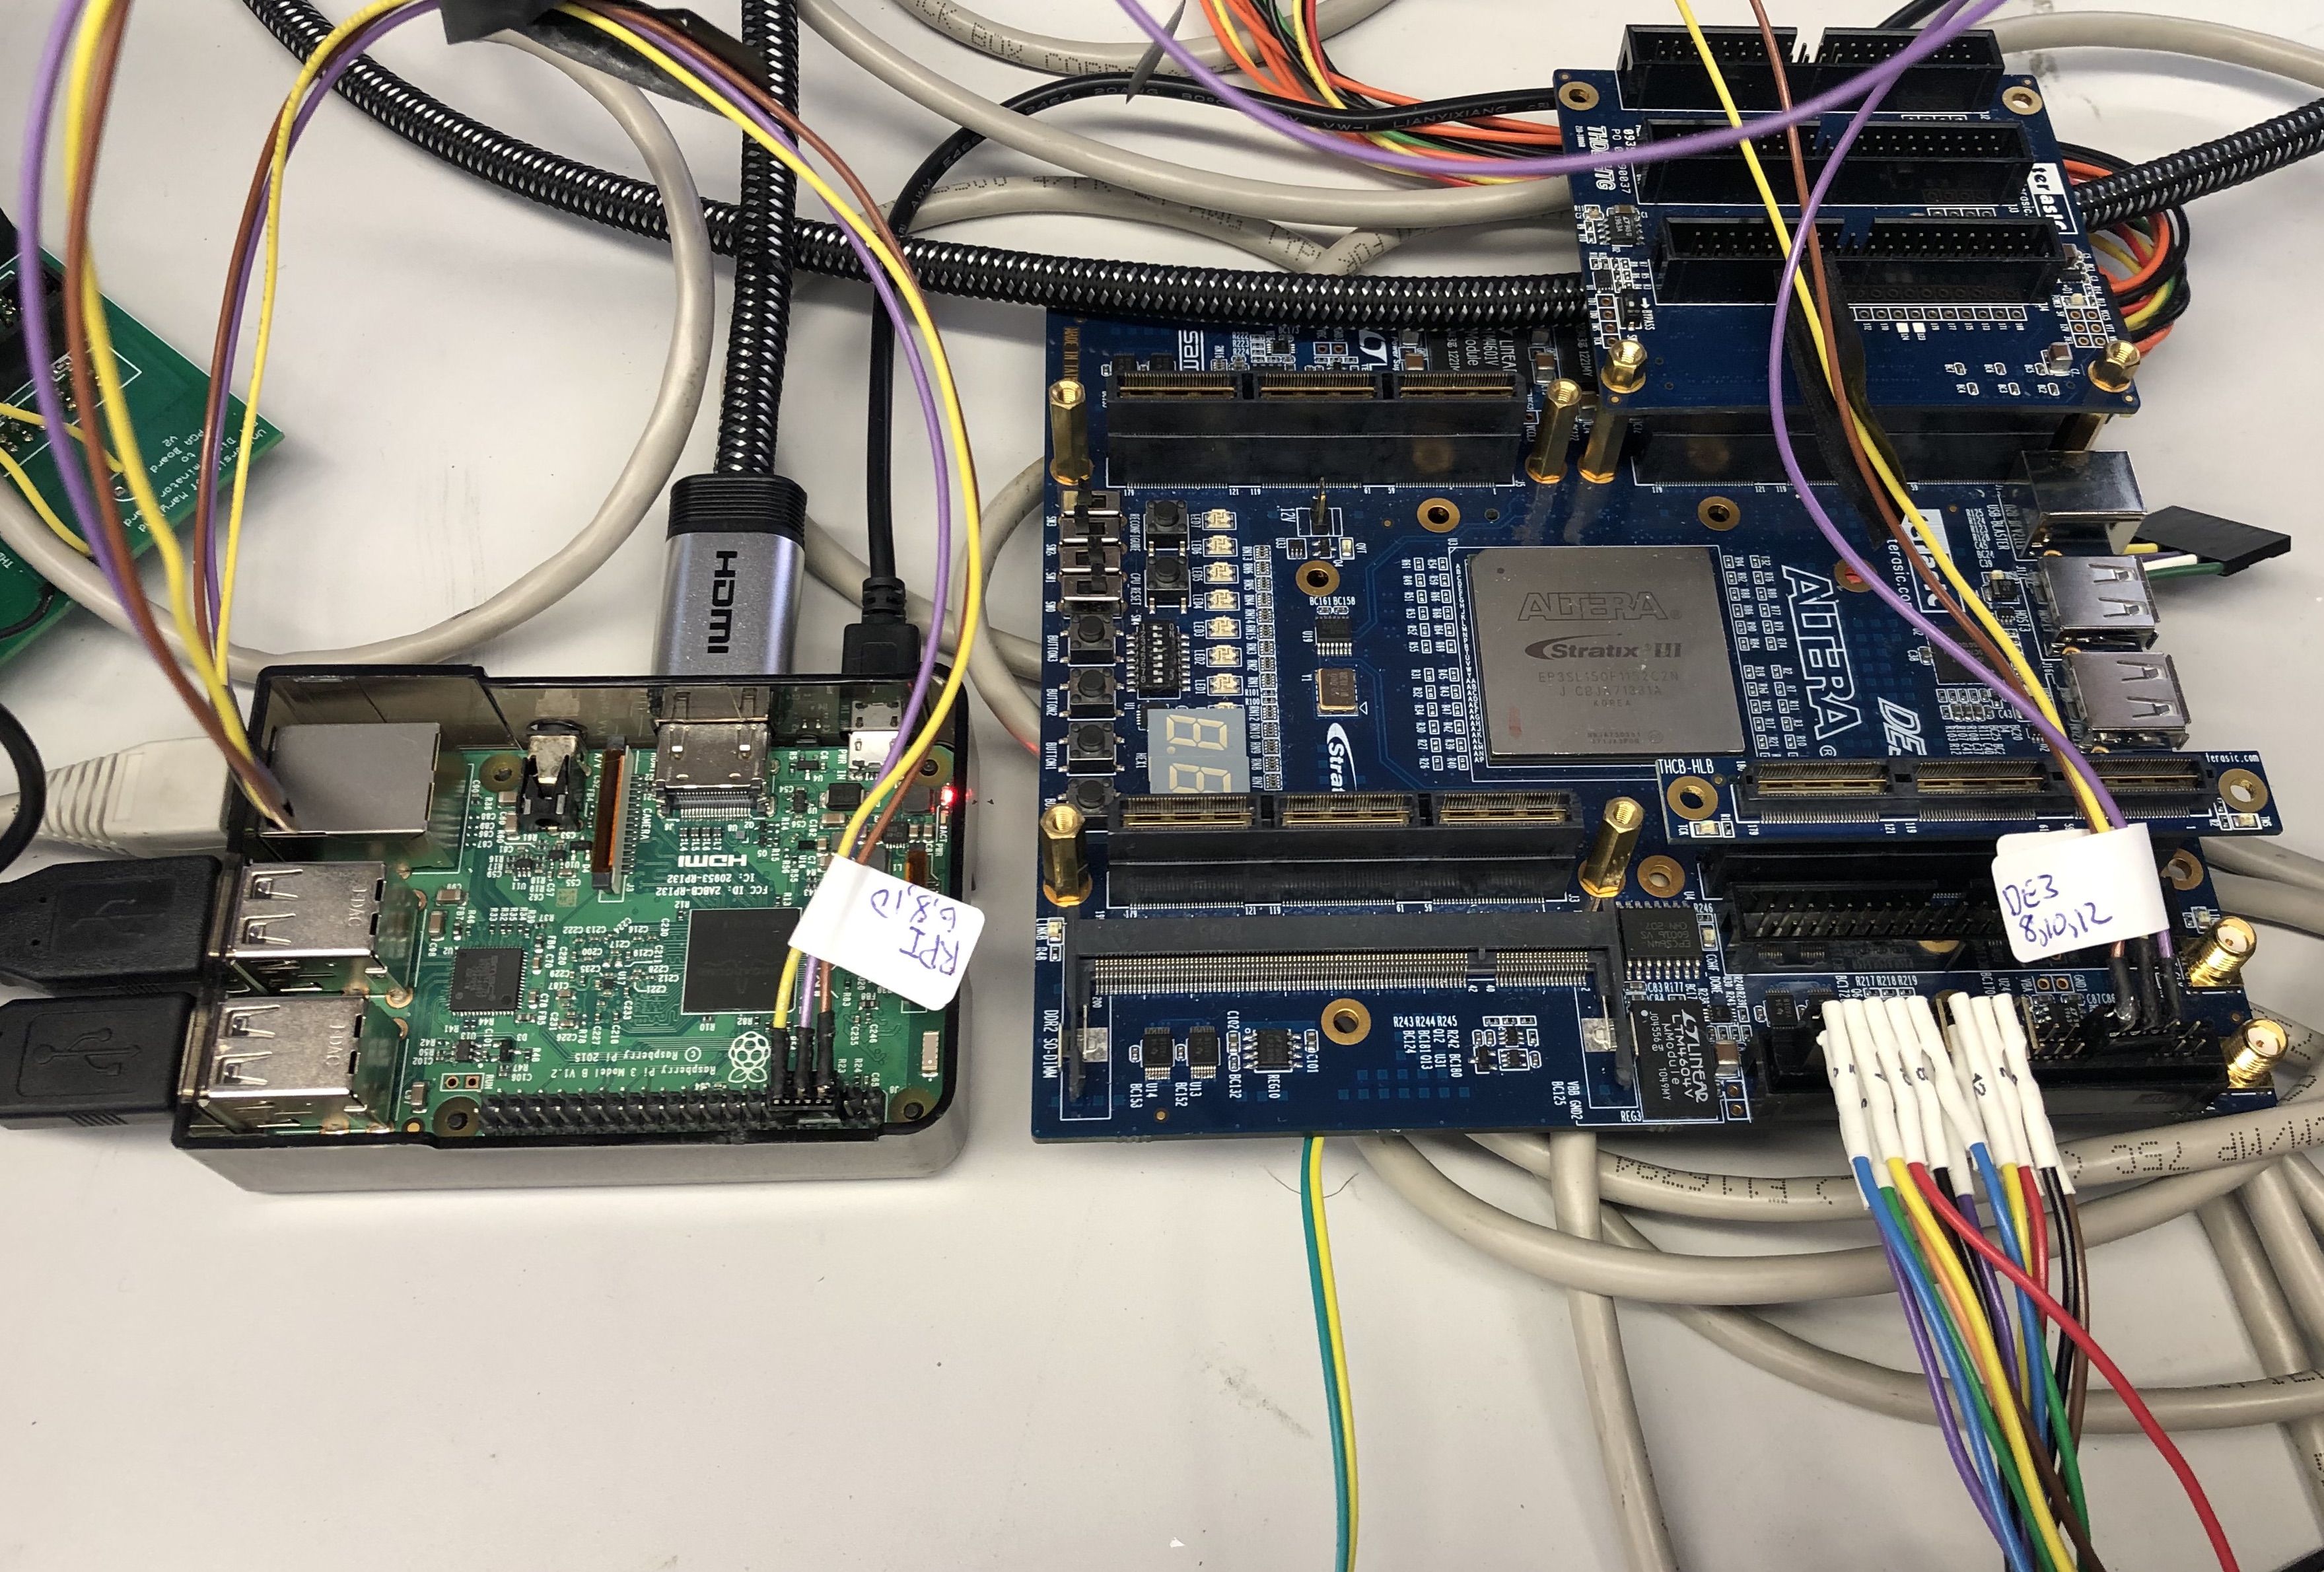
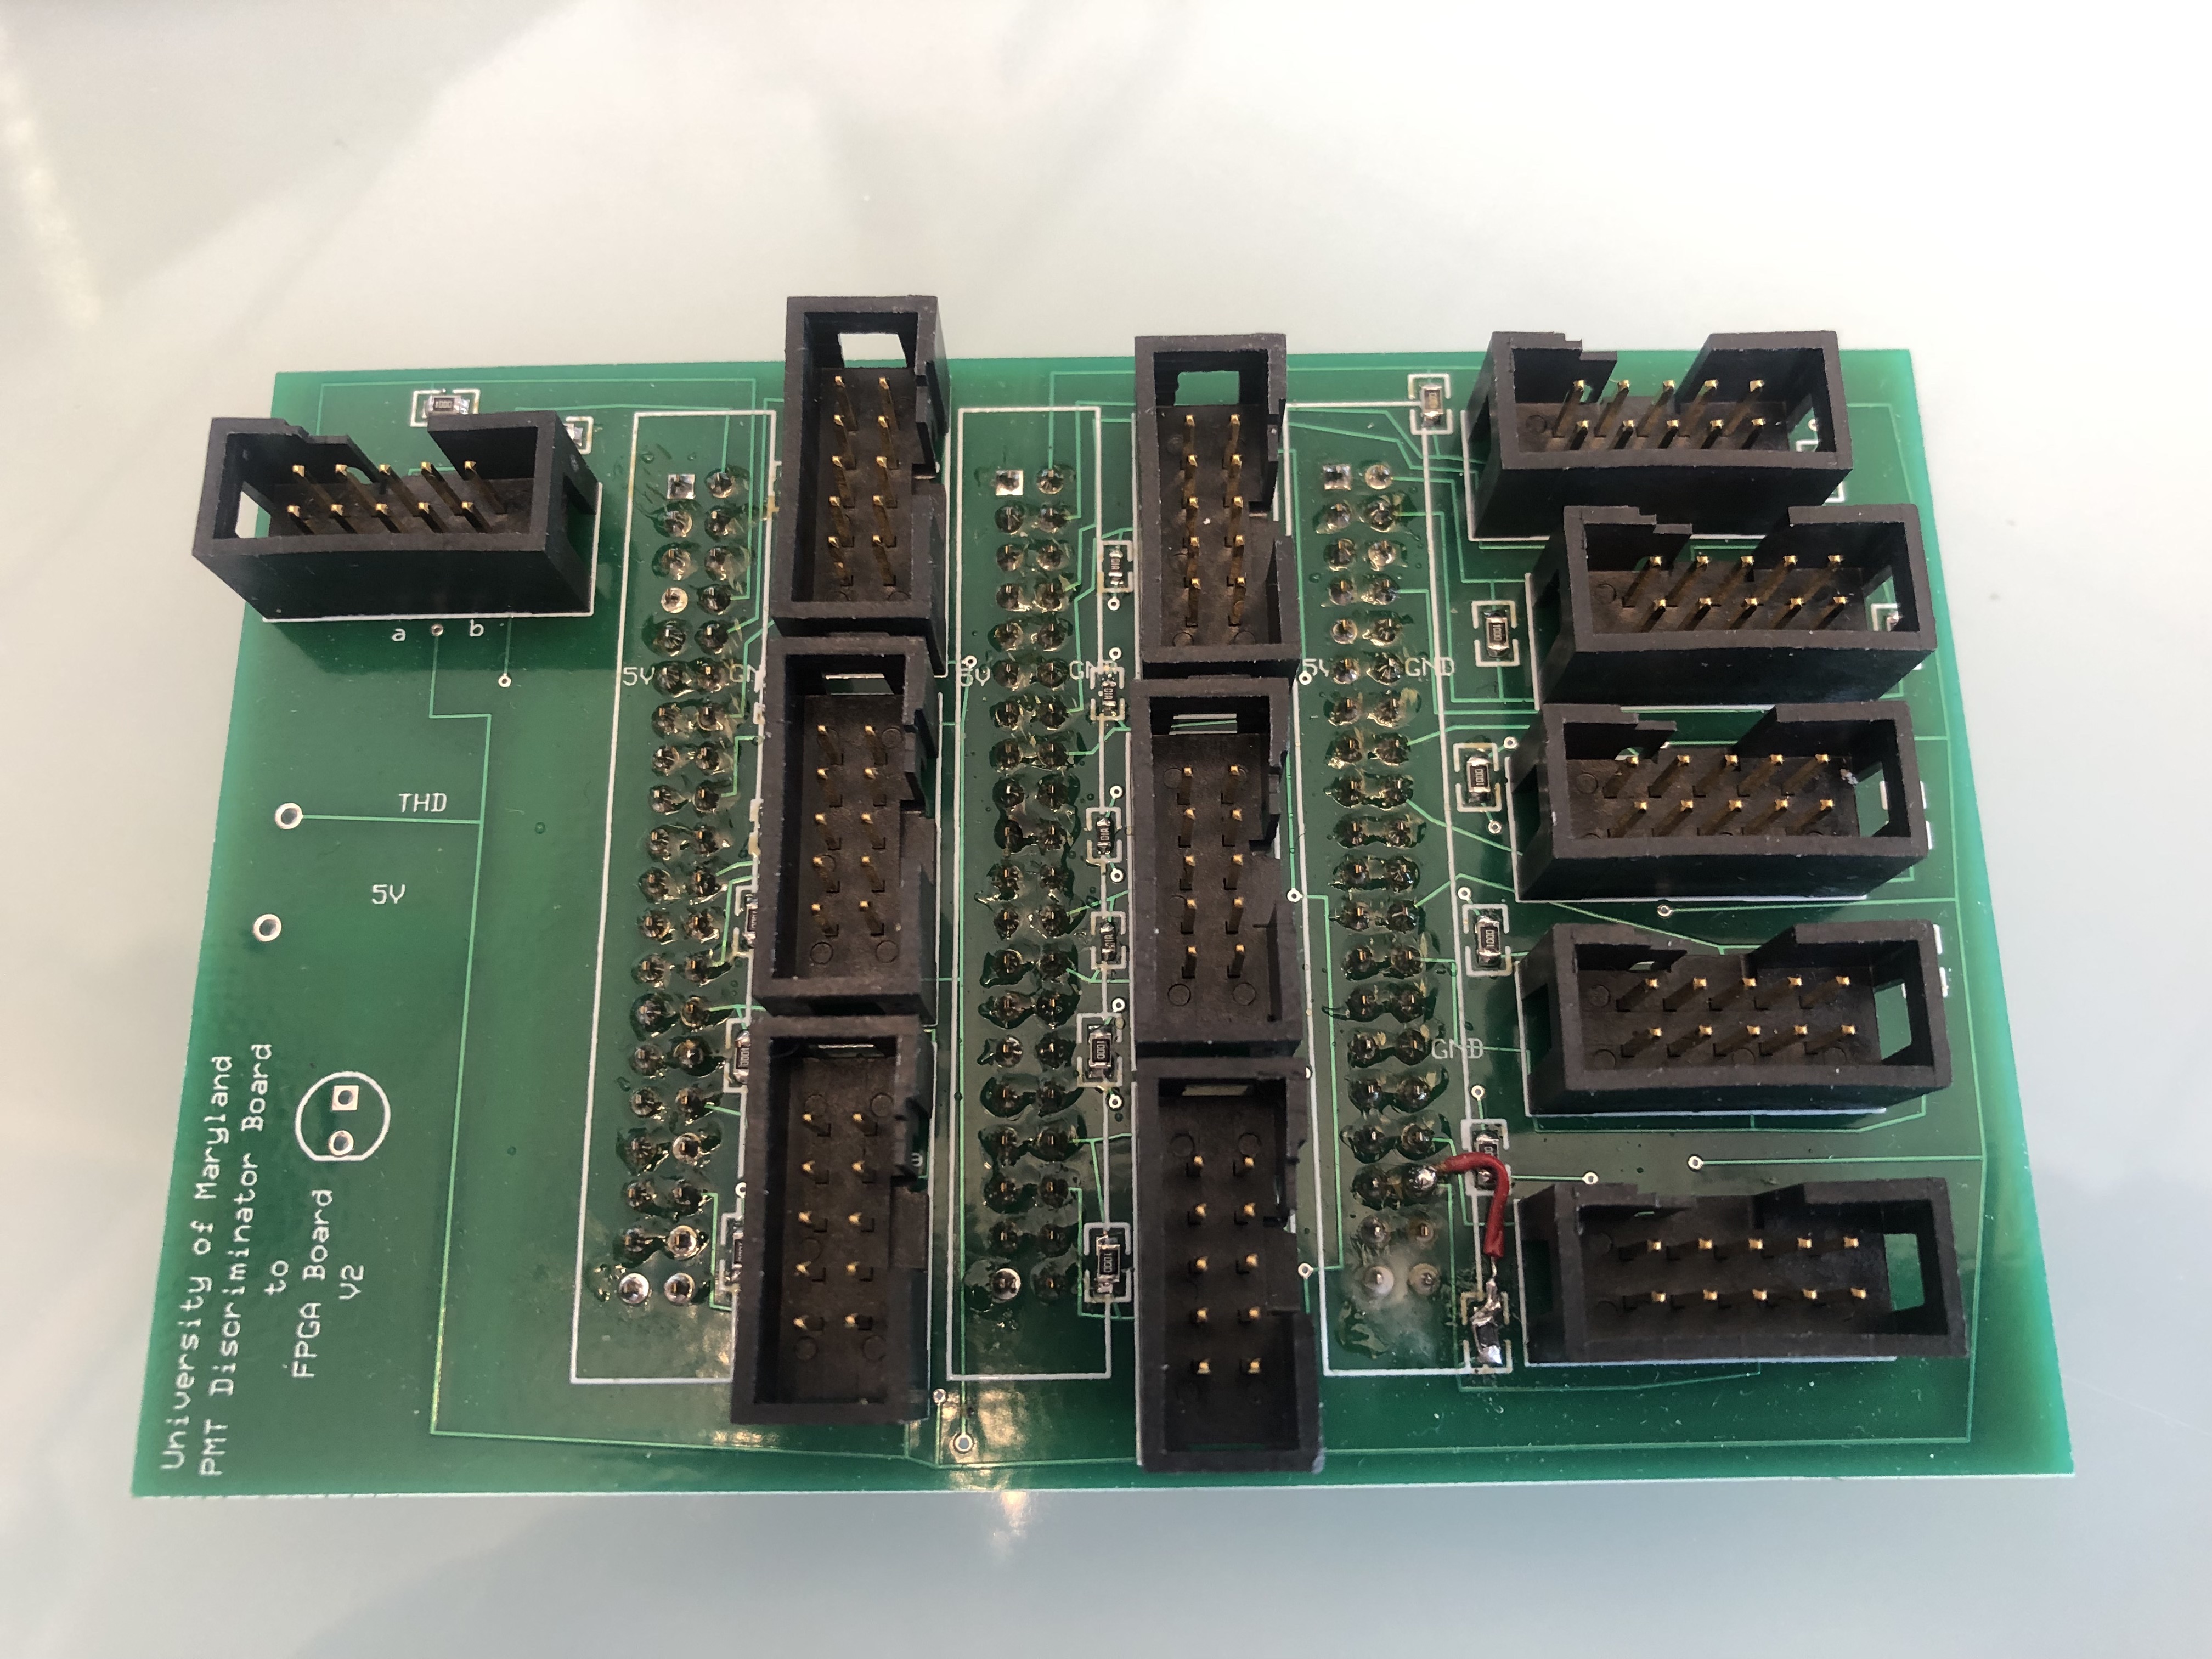
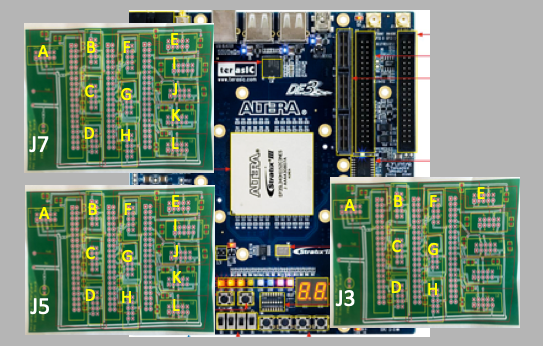
The following picture shows the connections. You can clearly see the 3-wire cable connecting the 2 boards, and the Saleae logic analyzer 16 pins connected to the GPIO pins on the DE3:
| DE3 | TX | RX | GND |
| FPGA Pin | AD26 | AF29 | N/A |
| GPIO1_ | D5 | D7 | N/A |
| JP14 pin | 8 | 10 | 12 |
| RPI | RX | TX | GND |
| GPIO pin | 8 | 10 | 6 |
Software
The DE3 board uses the Altera Stratix III FPGA, so (at this time, 2019) you have to
use the old version 13.1 of Quartus II. This is detailed on the Altera page
here. To download the software, go to
this page and grab the right version. Be sure to grab the "Subscription Edition"
so that you also get the ability to download firmware.
License
And you will need a license. If you don't have the right license, you won't be able
to make the download files. (I think that means don't get the "EVAL" license!) Getting
the license is probably the trickiest thing you can do, and starts
here. Consult an expert if you are
having problems!
Using Quartus
There's way too much to go over for this page. Best thing to do is to go over some tutorials on the web (google!) and ask for help. Lots of people know how to use Quartus.
Downloading
Here is how you download firmware from Quartus right to the flash RAM on the DE3, so that the firmware will be non-volatile.
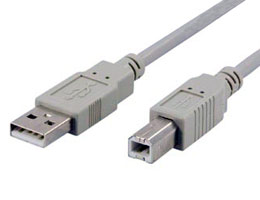
First, make sure you connect the right USB cable. You will need one that has a USB B connector on the end that plugs into the DE3, like in this picture.
When you plug the cable in, the Windows machine should see it even if the DE3 is not powered on. On the VMWARE machine I am using, the MAC pops up a window and asks if you want to connect it to the MAC or the Windows machine. Choose Windows. Then you can power it on if it's not already up.
Note that if you don't have the USB ByteBlaster driver installed, you can find it under the "Altera path"\quartus\drivers\ directory. You will also probably have to install it by double clicking on "Program Device" and follow your nose. The selected hardware will be "USB-Blaster [USB-0]" or something similar.
Now, assuming you've built the program down to the PAR (EDA Netlist Writer and everything before it completed successfully), then go into the "File" menu in Quartus and do the following:
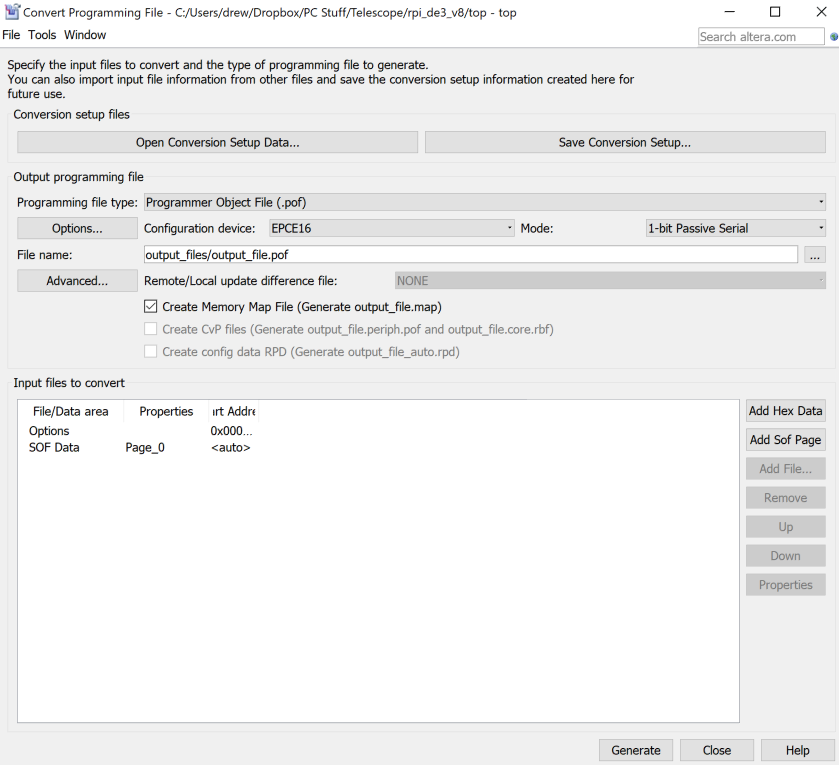
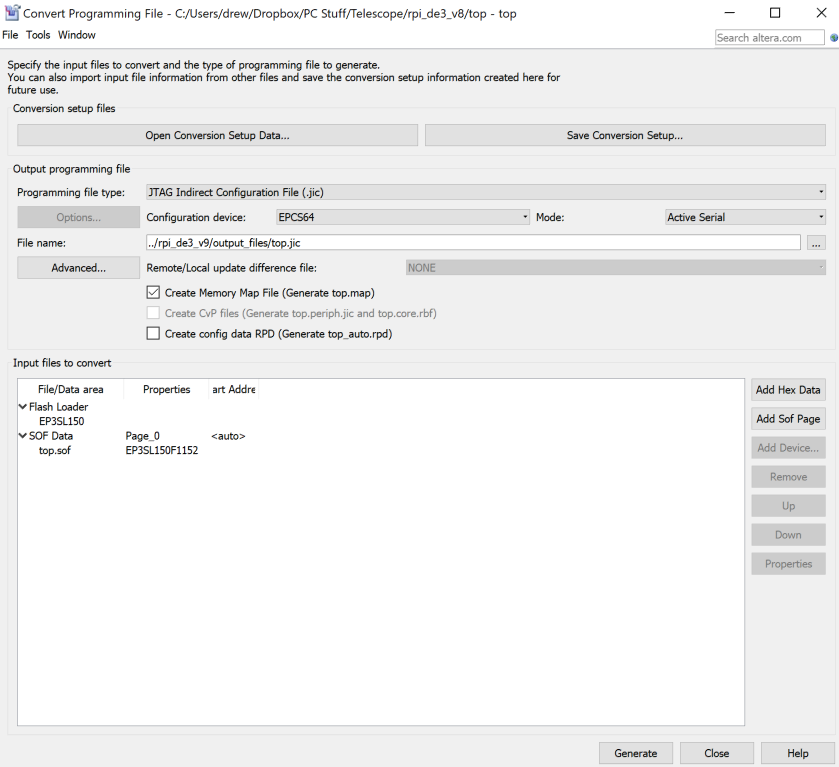
Close the window "Convert Programming File" window and double click on "Program Device (Open Programmer)" in the Quartus "Task" window. That should bring up a new window that looks like this:
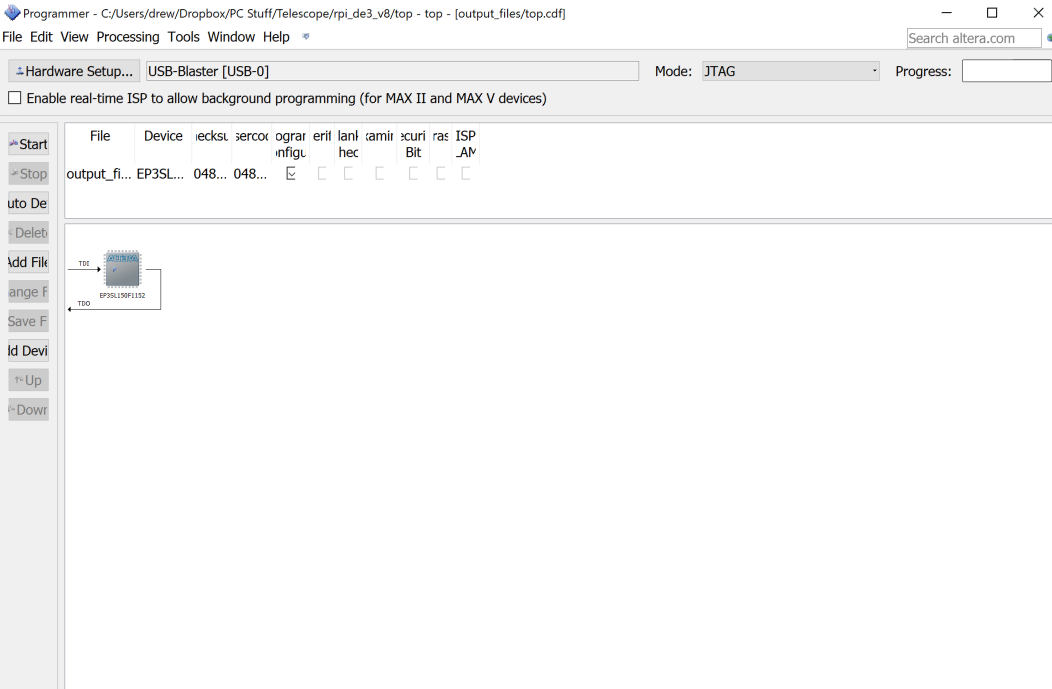
Note that in that window, the "Hardware Setup" should say "USB-Blaster [USB-0]". If it doesn't, then somehow your FPGA is not connected to USB. Try unconnecting and reconnecting the USB cable and see if it mounts it. Windows should be able to get the latest drivers, but if it doesn't, then you can add the drivers by hand. They are in the directory where you installed Quartus, in <dir>quartus/drivers somewhere (depends on whether you are using 32 or 64 bits, etc.).
We are using a Raspberry PI we got from Adafruit (comes with nice peripherals, plastic case, etc). It's an RPI 3 Model B v1.2 and dates from 2015.
WHen the 1st window comes up, clikc on "Raspbian" and hit install. This runs the script that installs debian and a few other things (minimal). To get wifi to work, open the Raspberry Pi Configuration tool and go to Localisation. Set the Wifi Country Code to US, set lcale and time zone, and set the mac address to 129.2.92.106. Should work.
Reboot and then do a few updates:
o sudo apt-get update
o sudo raspi-config
	change password to "ilovecms" (no ")
o preferences/keyboard change from UK to US English (US, with euro on 5)
o sudo apt-get upgrade    (takes a loooooong time)
o sudo apt-get autoremove
I did not do "apt-get dist-upgrade" and I did not do "sudo rpi-update". (I forgot why!). Then do the following additional housekeeping things that gets tcsh, python, etc.
o sudo apt-get install tcsh
o sudo nano /etc/passwd and change password for pi  to bin/tcsh and reboot
o sudo apt-get install python3-serial
o copy .cshrc from login/rpi
Then in Preferences, set the resolution of the monitor to CDA mode 31, 1920x1080 50Hz 16.9, enable VNC and Serial interfaces (important!!!!), and reboot.
Then a few more things to install:
o sudo pip3 list                        shows numpy 1.12 already installed
o sudo pip3 install matplotlib          installs 2.2.2
o sudo pip3 install numpy --upgrade     numpy is now up to 1.15.0
o sudo apt-get install libatlas-base-dev
o sudo pip3 install histogrammar
o sudo rasps-config
	set Interfacing Options to Serial
	turn OFF "login shell to be accessible over serial"
	turn ON "serial port hardware enabled"
And reboot.
The RPI is configured so that when it comes up, it runs the VNC server. To connect to it, I use the "VNC Viewer" app on the MAC, and connect to 129.2.92.106.
The main user space is /home/pi and you will see a .cshrc file there. The subdirectory called uart/ has the python code. The .cshrc defines a command called "copyit" that will copy everything in uart/ to my desktop. To invoke the code, go to uart/ and do
python3 de3_v8.py
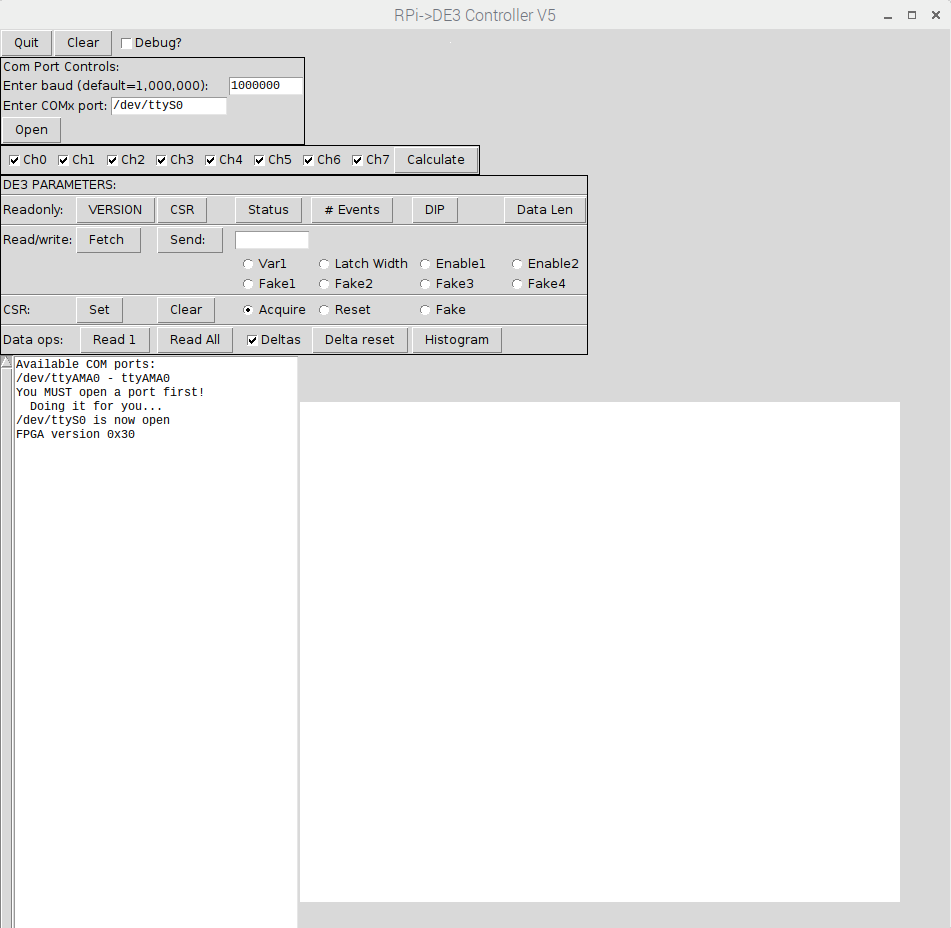
or whatever the latest version is. You should see the following window pop up:
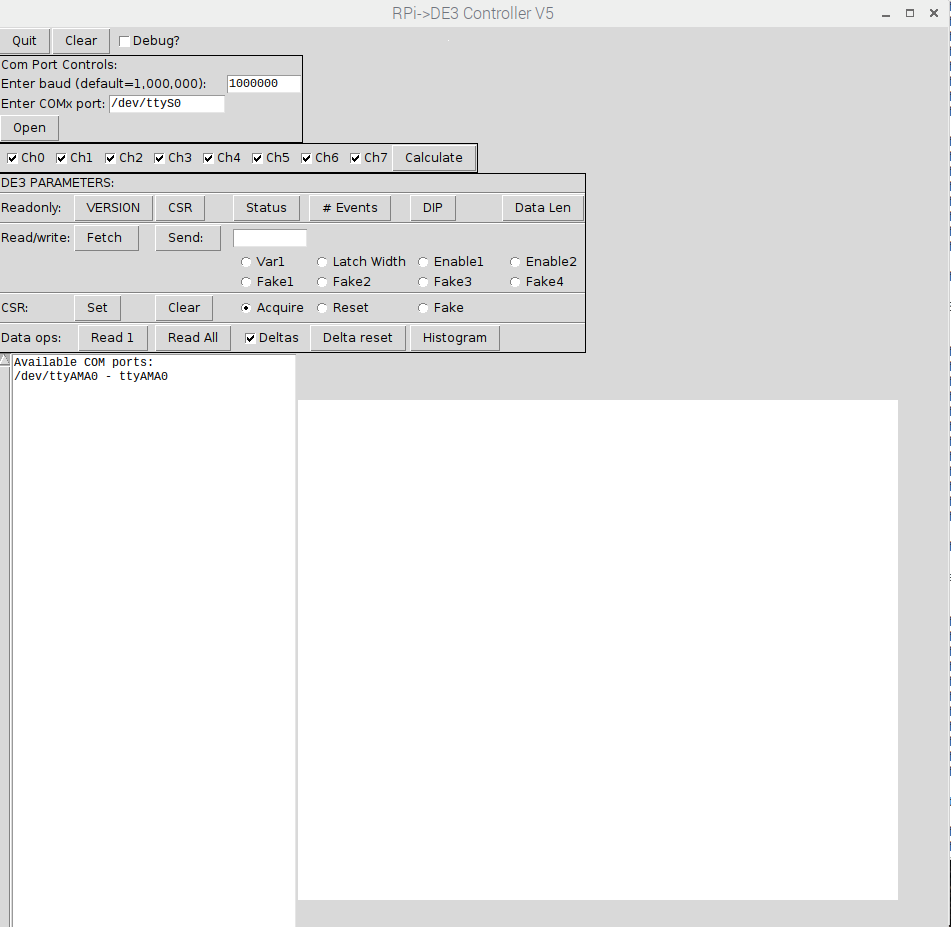
In the "DE3 PARAMETERS" window, you will see a row that starts with "Readonly", and lists readonly parameters that you can read from the DE3. Hit the "VERSION" button and it should ask the DE3 for the FPGA version through the UART. Here it comes back to 0x30 (June 2019). It should look like the following. Note that the code knows whether you've opened the COM PORT or not, and if not, will do it for you.
| Register | Addr (hex) | Usage |
|---|---|---|
| VERSION | 0x1 | Read FPGA Version |
| DIP | 0x2 | Dip switch value |
| Data Len | 0x4 | Data Length (full mode is 64) |
| Status | 0x5 | Running status |
| Var1 | 0x6 | 4-bit Mux for debugging, out to LA |
| CSR | 0x7 | Control Status Register |
| Latch Width | 0x8 | Width of Latch (in what?) |
| #Events | 0x9 | Number of events triggered |
| Enable1 | 0xA | ??? |
| Enable2 | 0xB | ??? |
| Fake1 | 0x12 | ??? |
| Fake2 | 0x13 | ??? |
| Fake3 | 0x14 | ??? |
| Fake4 | 0x15 | ??? |
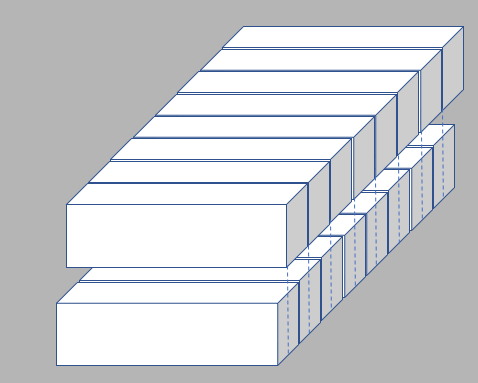
There are 4 double planes (called "wedges") of scintillator, stacked 8 to a plane. Each plan is offset a half scintillator width (around 1 in) from the one right above (or below) it. The first level trigger looks to see if any of the 8 scintillators was "hit", defined by asking whether in some period of time (defined by the R/W parameter "latch_width"), there was a signal of any length greater than 20ns. The way it works is that there's a state machine that resets all latches (1 per input), then enables the latch, then counts using the 50MHz clock (20ns ticks) for "latch_width" (default set to 50) ticks. Then it latches all the latches and resets so it's ready for the next try. That means for each channel, it will ask whether within a 20ns times 50 ticks (programmable) time window, or 1usec, there's a hit in that channel.
Once the 1us period is up, it will then form a trigger using the active scintillator channels. An early version of the code (0x30) asks whether in a plane of 8 channels, there's at least 1 tube that saw a signal come in. Any kind of trigger condition is possible, but you have to edit the code top.v. It's all controlled in the state machine around line 417 (in version 0x30), and specifically in the state LTRIGGER.
For each 1us period, the code will take the data from all channels (verison 0x30 only has 16 channels active, or 1 double plane, or 1 wedge, however you want to say it!), and form a 64-bit vector that can be put into a fifo. The vector has the format:
	{nevents_seen[15:0],
	1b0,rdempty_sig,rdfull_sig,wrfull_sig,rdempty_sig,rdfull_sig,wrfull_sig,1'b0,
	24'h0,
	bank2_latch[7:0],
	bank1_latch[7:0]}
That makes 8 bytes, and will have to be extended when we get all 8 layers
going. Once this vector is formed, the trigger condition just described
(e.g. at least 1 hit in either layer) causes the vector to be written into
the fifo. There are actually 2 fifos: one has that was just described,
and the other is a 64-bit counter with 20ns resolution. This allows us to
do some timing on the relative time of arrival of any event.
The fifo is read by reading from register 0x3, 16 times (once per byte, 8 bytes for the data fifo and 8 for the counter). If there is nothing in the fifo's (empty) and you try to read, you will get back the pattern 0xdeadbeefcafefade for the data and 0x0 for the counter.
At this date (7/13/19) we have only implemented 1 wedge, which means 16 inputs on 2 banks (planes). The trigger conditions in the firmware will allow you to trigger on:
There is a 64-bit register called "fifo_fake" that can be used for testing, where you can substitute that fifo for the data coming in. You do this by setting the 4 RW registers "Fake1", "Fake2", "Fake3", "Fake4" in the "Read/Write" section of the control software, then set the "Fake" bit in the CSR (bit 2, you can set/unset it in the "CSR:" section of the control software). You should set all 4 registers, because the default is something goofy like 0xa5a55a5adeadbeef. Note that each of the 4 "fake" registers are bytes, so you can only set the bottom 4 fo the fake 64-bit fifo.
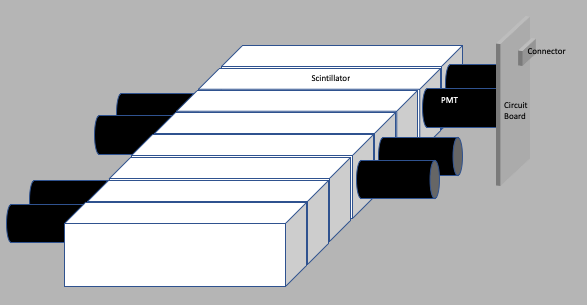
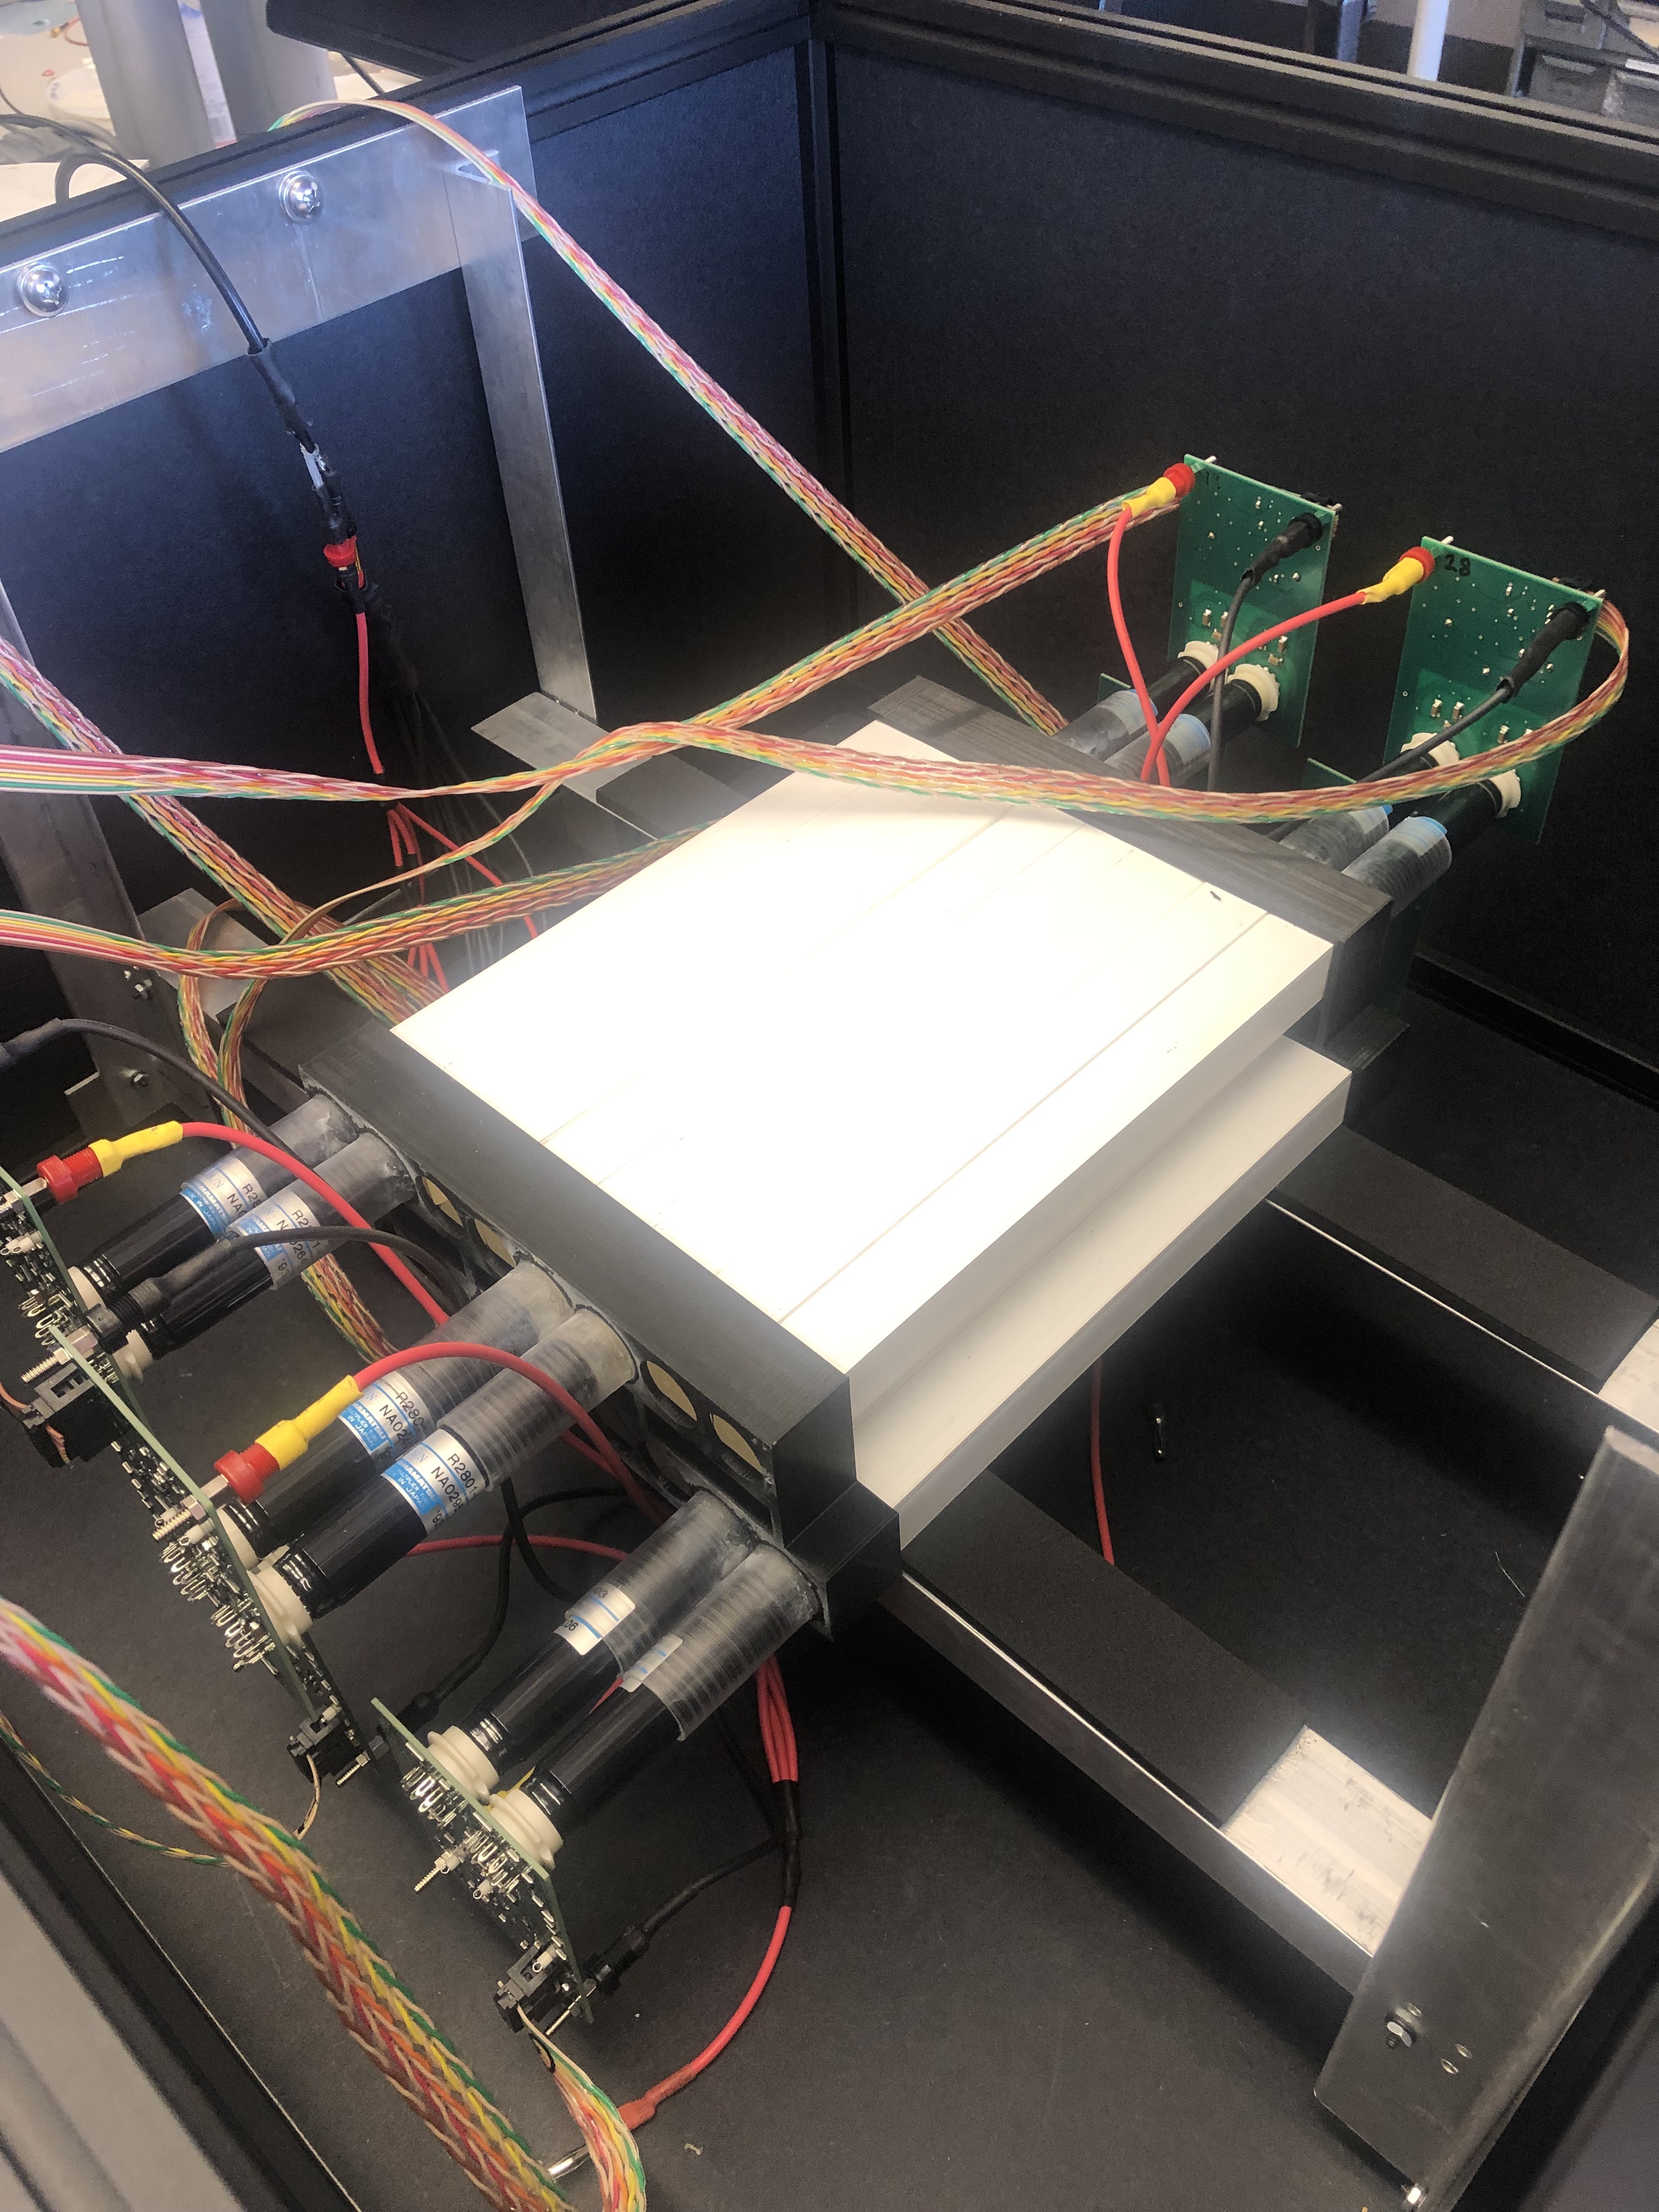
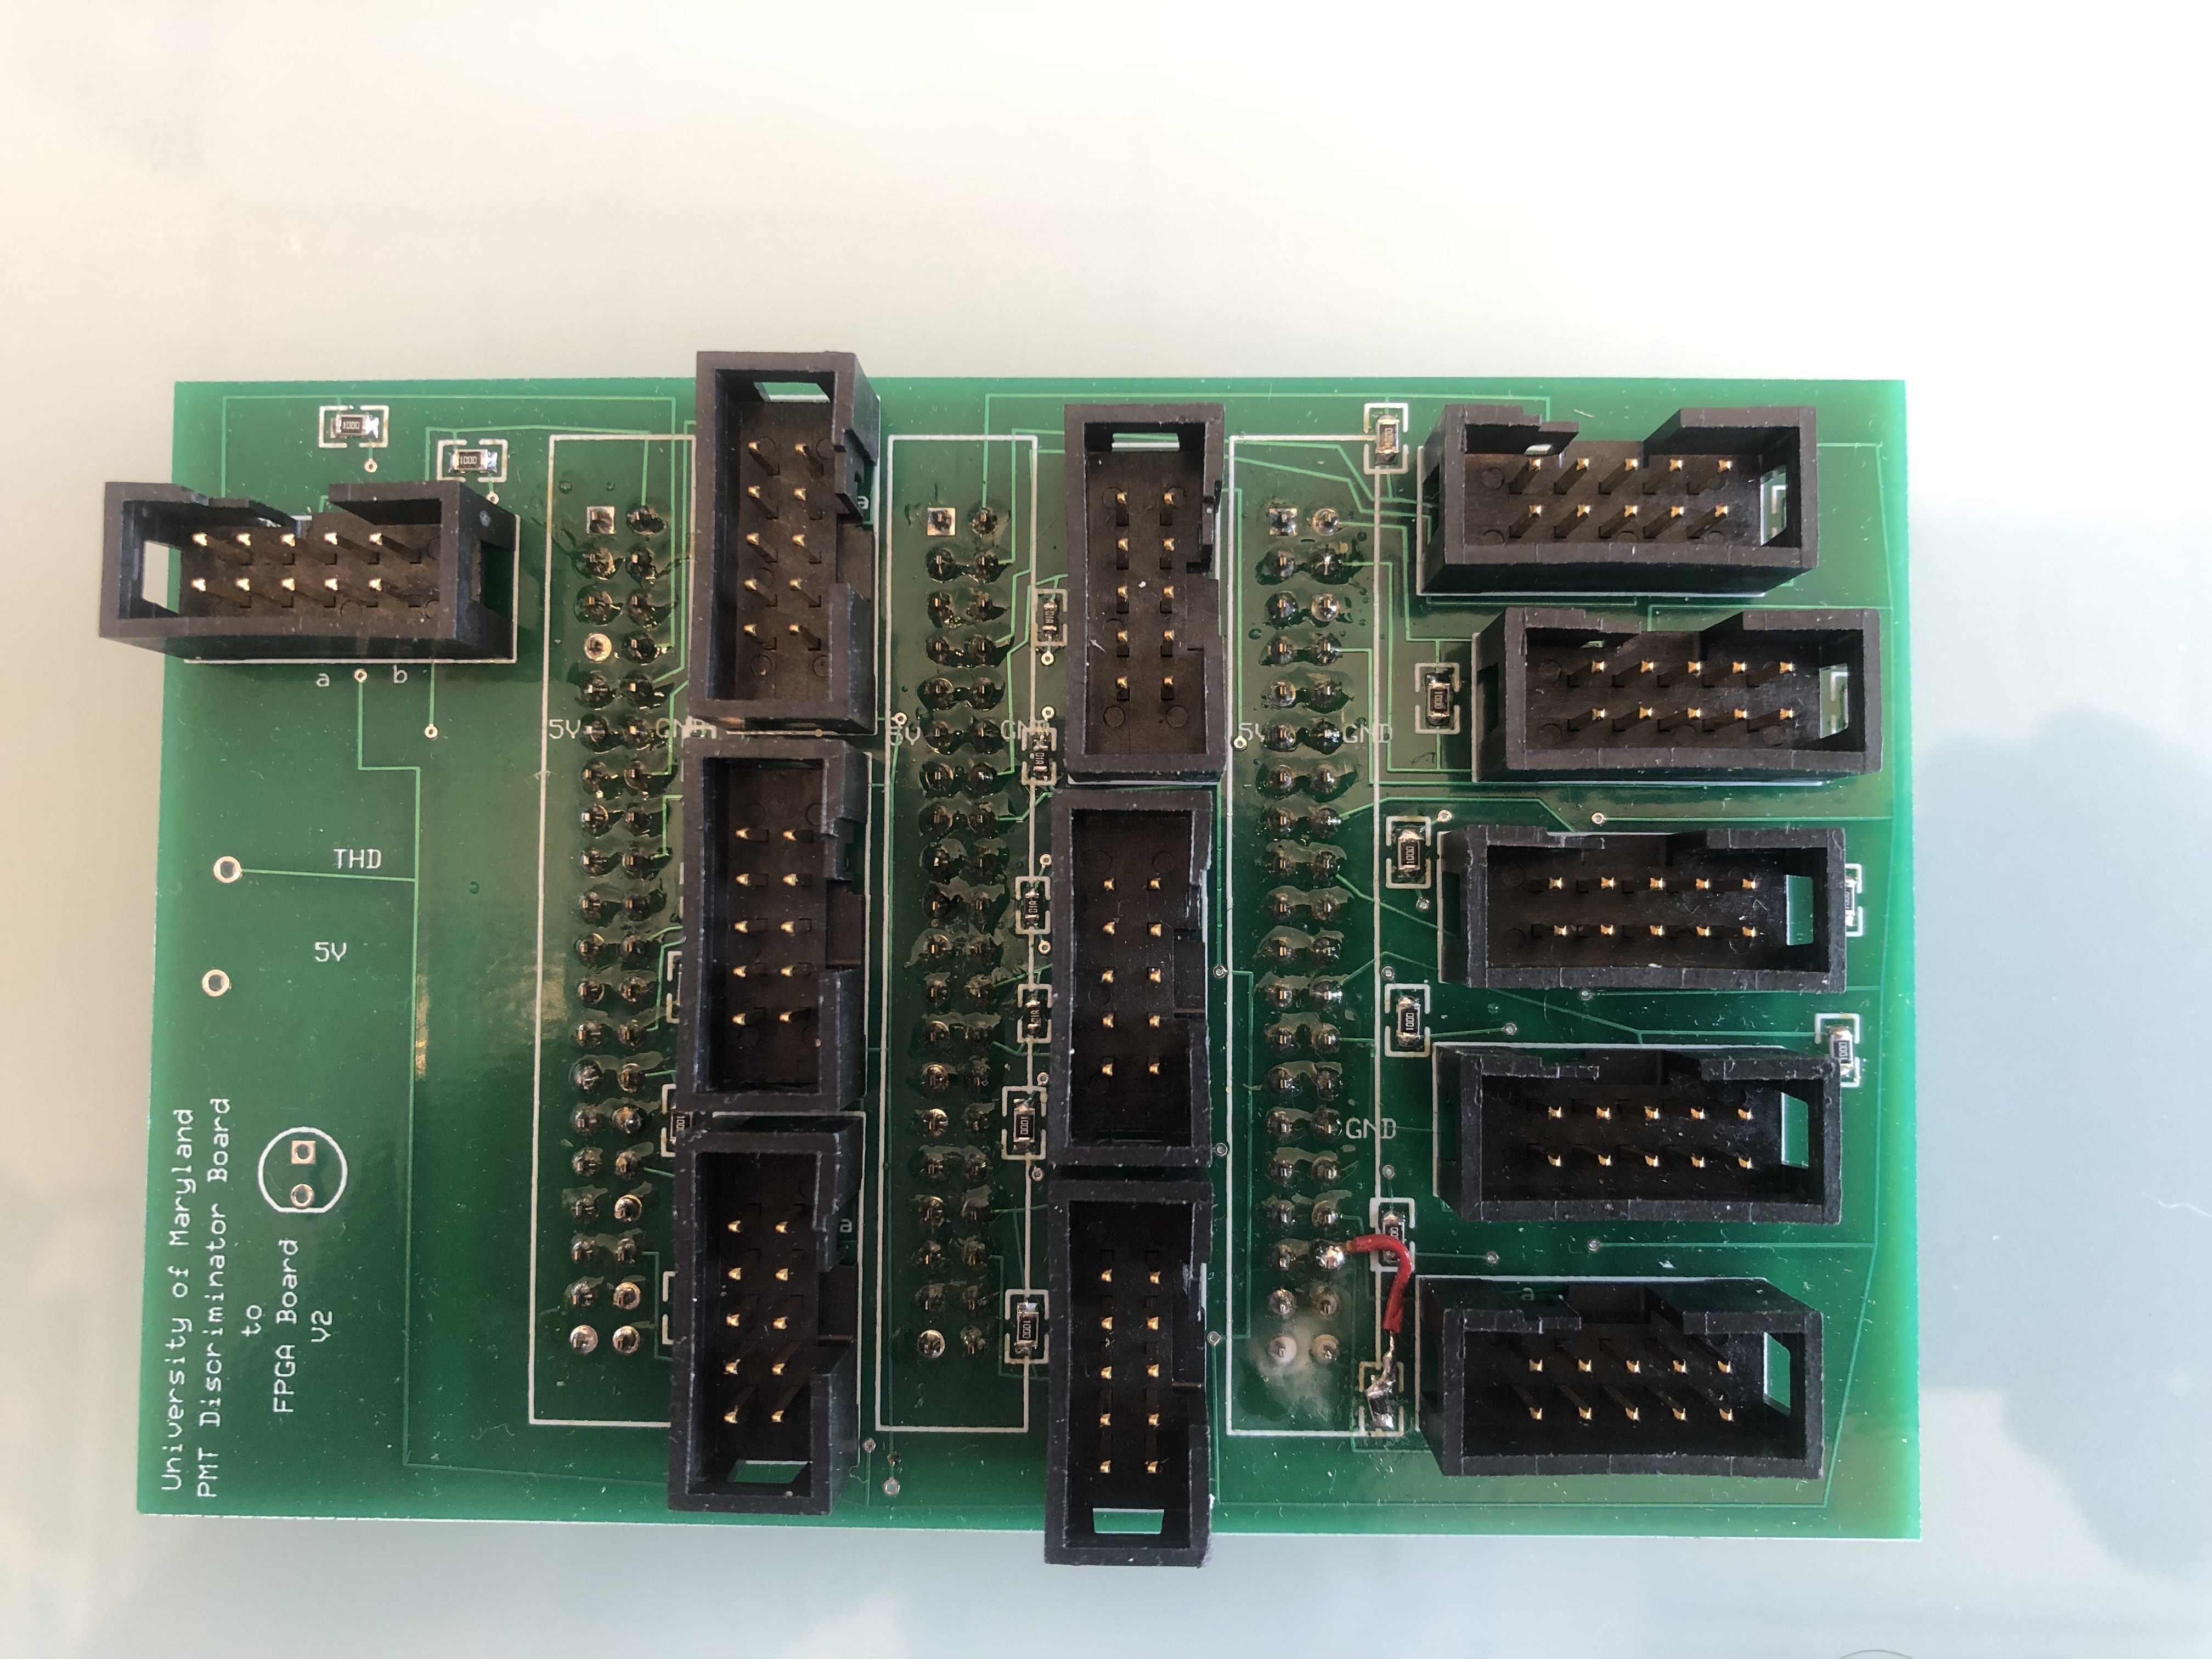
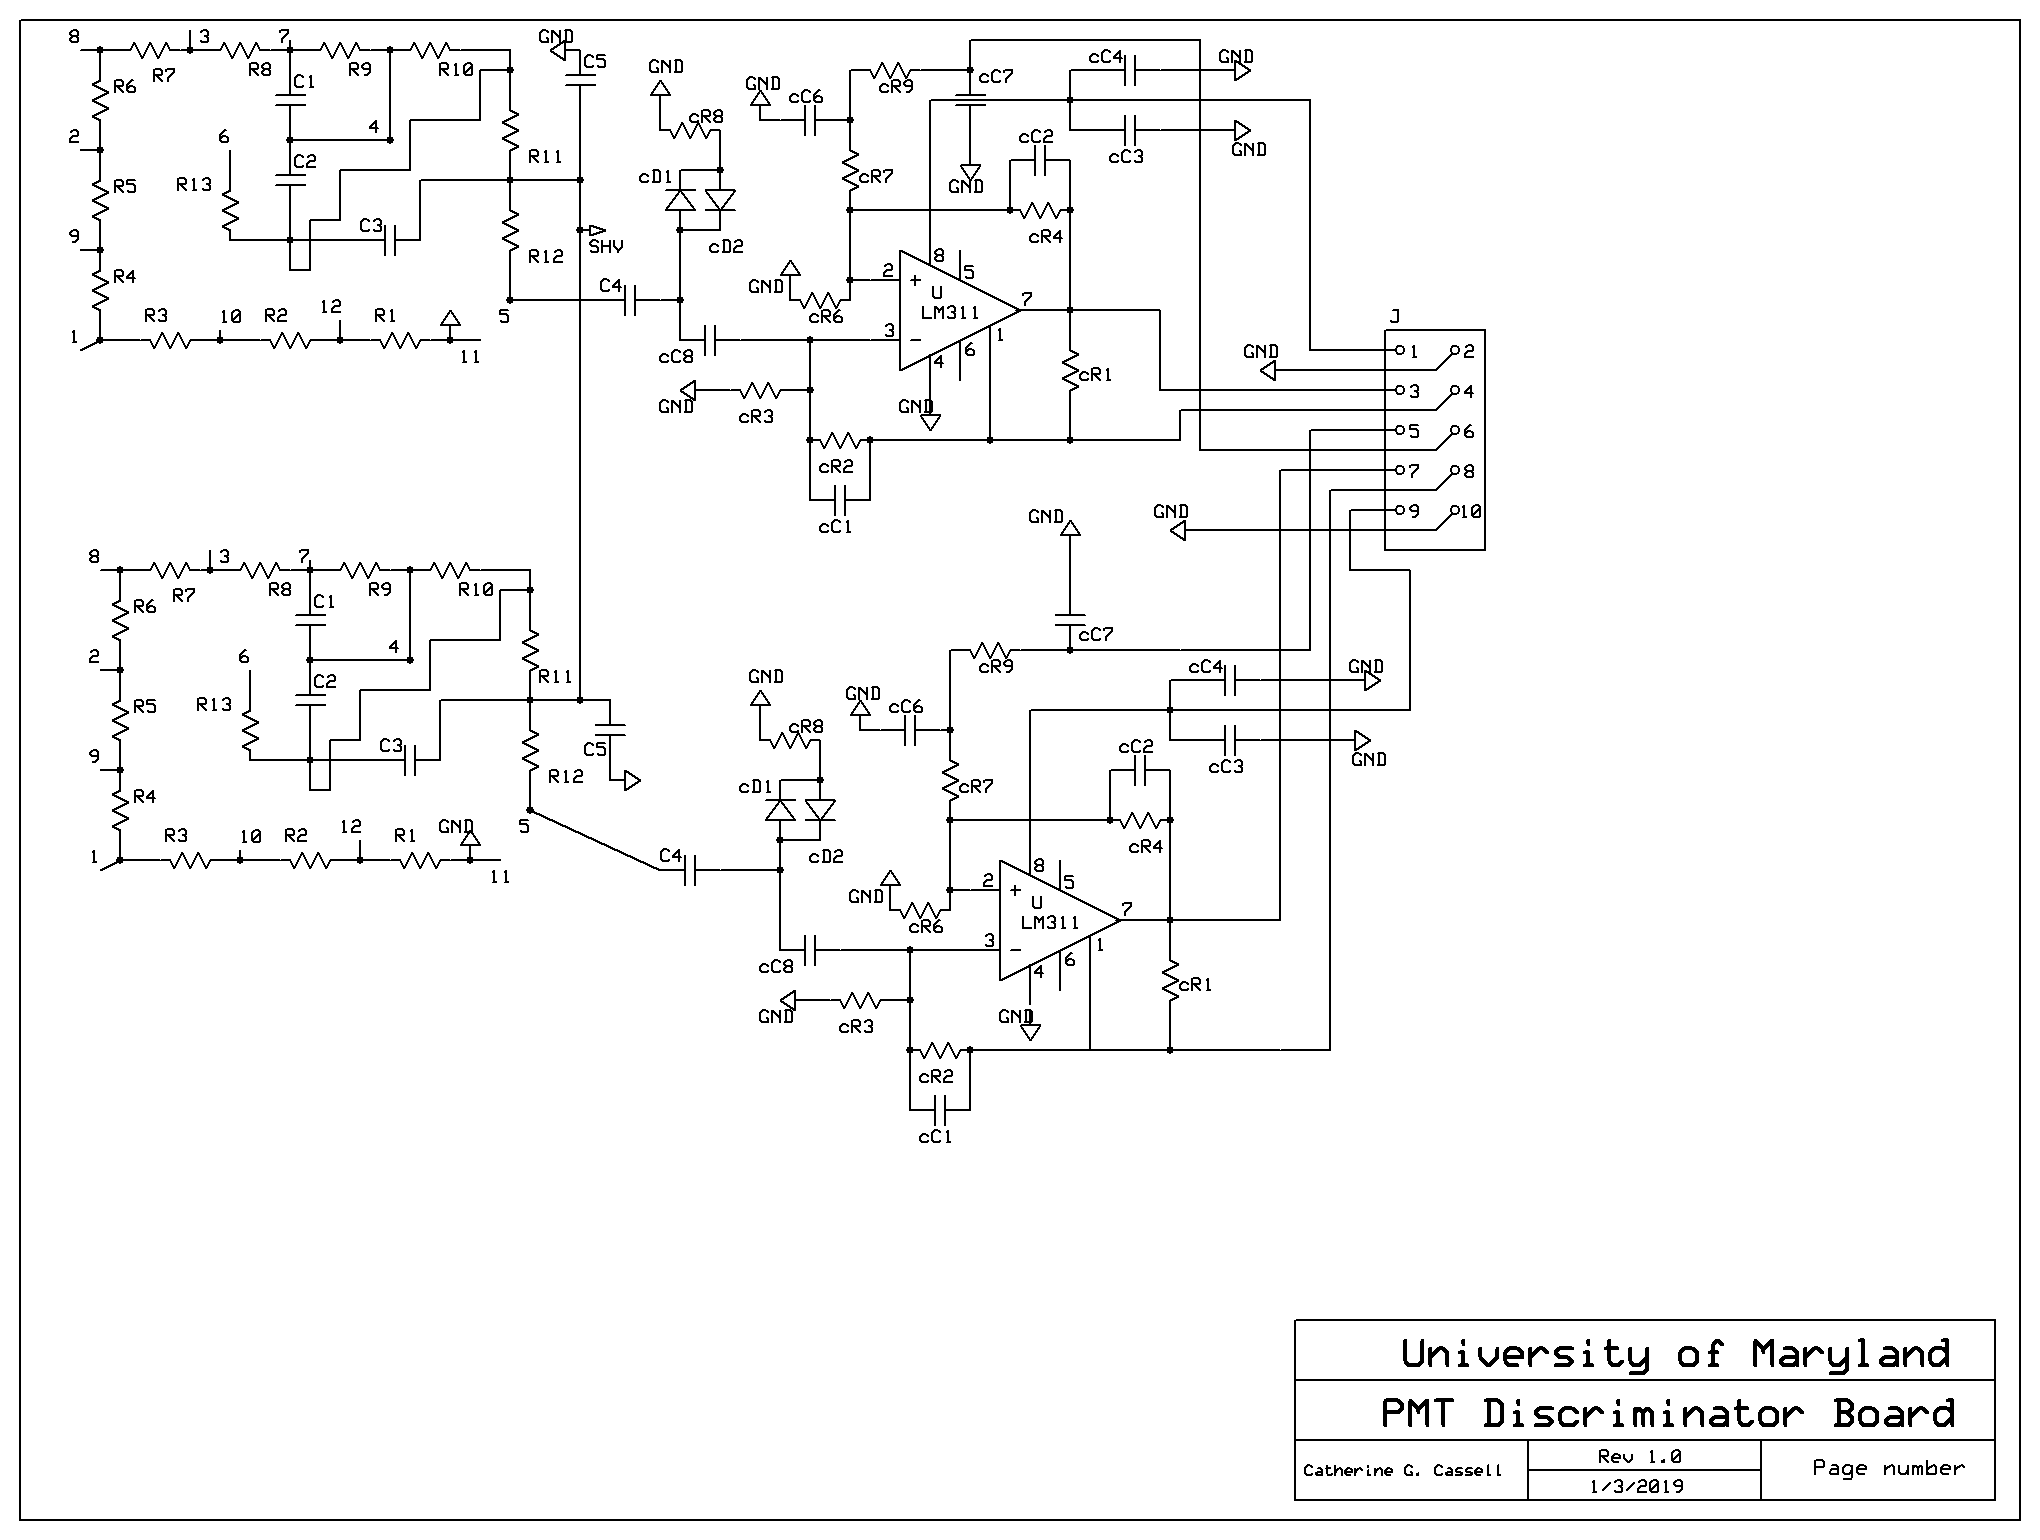
Each plane consists of 8 scintillators, with 2 to a PMT board. The PMT board has the resistive network for the PMT dynodes, HV connectors, and the discriminator chip (which takes 5.0 Volts), and a cable sending the data differential to the DE3. The following is a schematic, followed by a real picture.
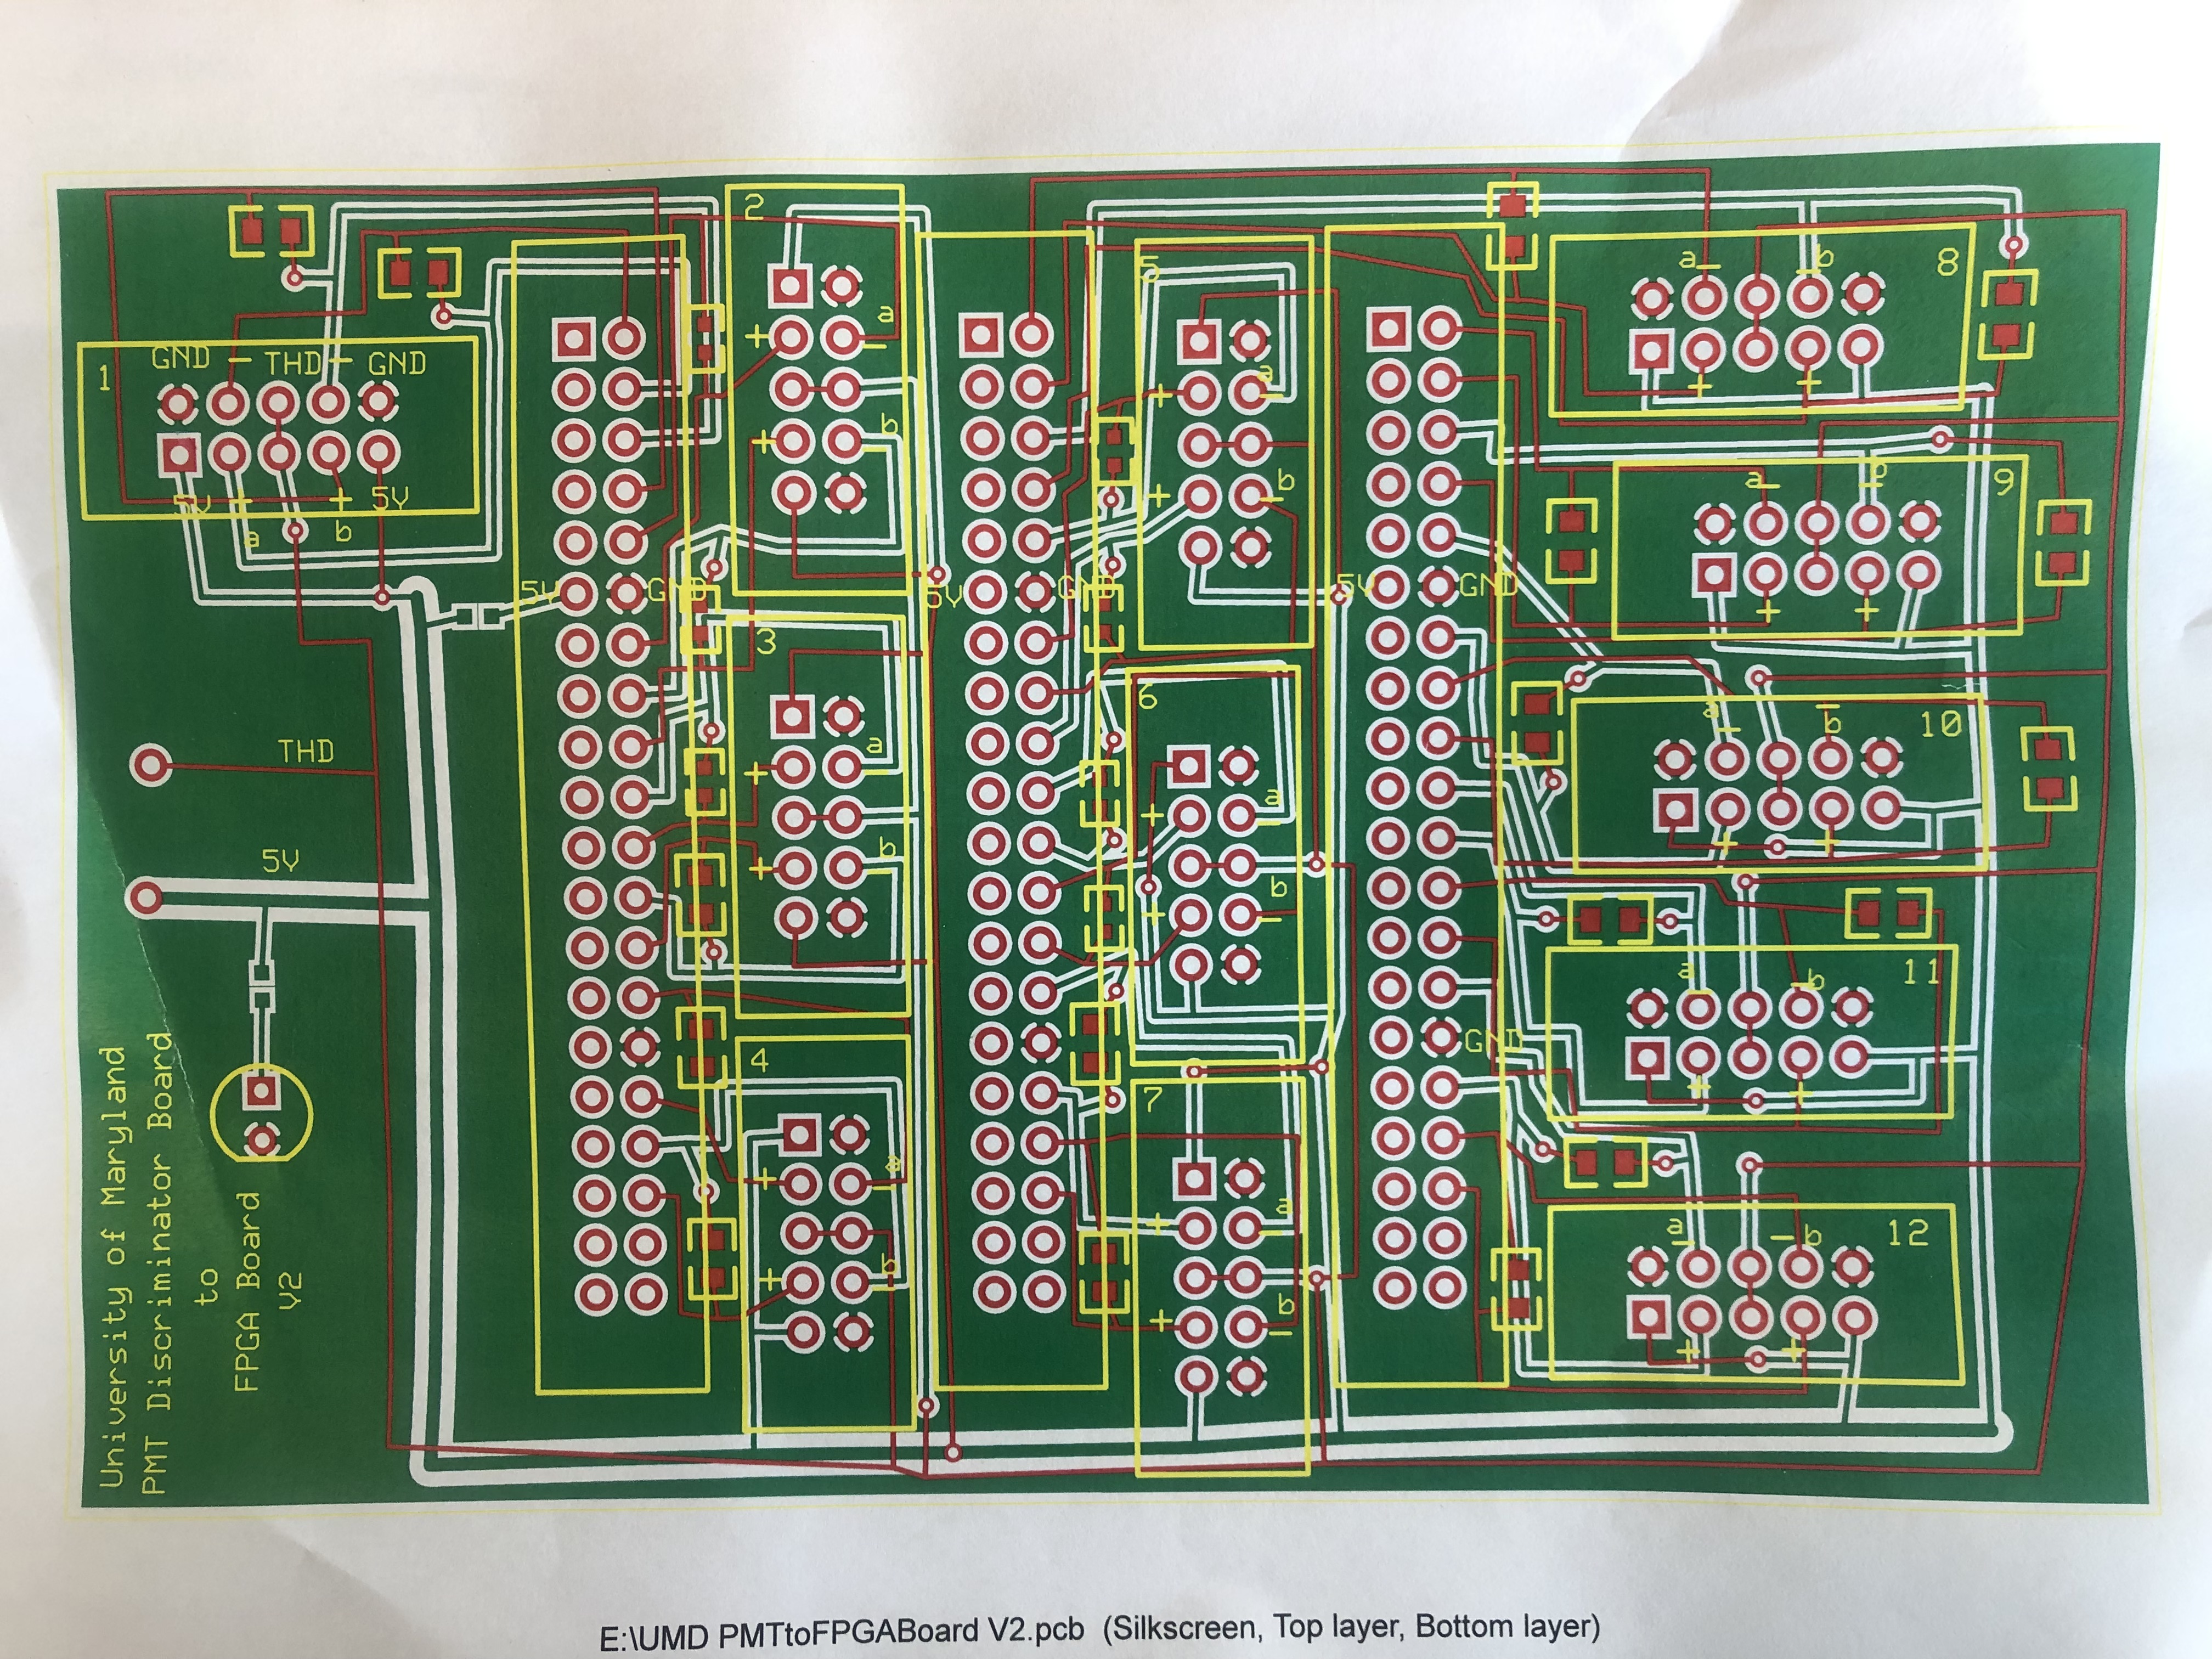
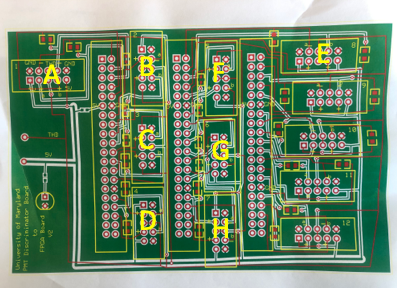
So from each plane there are 4 PMT boards, so 8 PMT boards per wedge. The signals from the 8 boards are then connected to an adapter board that Catherine Cassell laid out:
In the following schematic, the 12 connectors are labelled 1-12. (To test 1 wedge, we only need 8.)
The 8 cables from the wedge are plugged into 8 of the 12 UMD adapter connectors,
and those 12 connectors map onto the THDB using the following mapping. Note that
J2 has cables 1-4, J3 has cables 8, 5-7, and J4 has cables 9-12. This is just
an artifact of the way the board was laid out, but you have to be sure you know
which cable comes from which PMT!
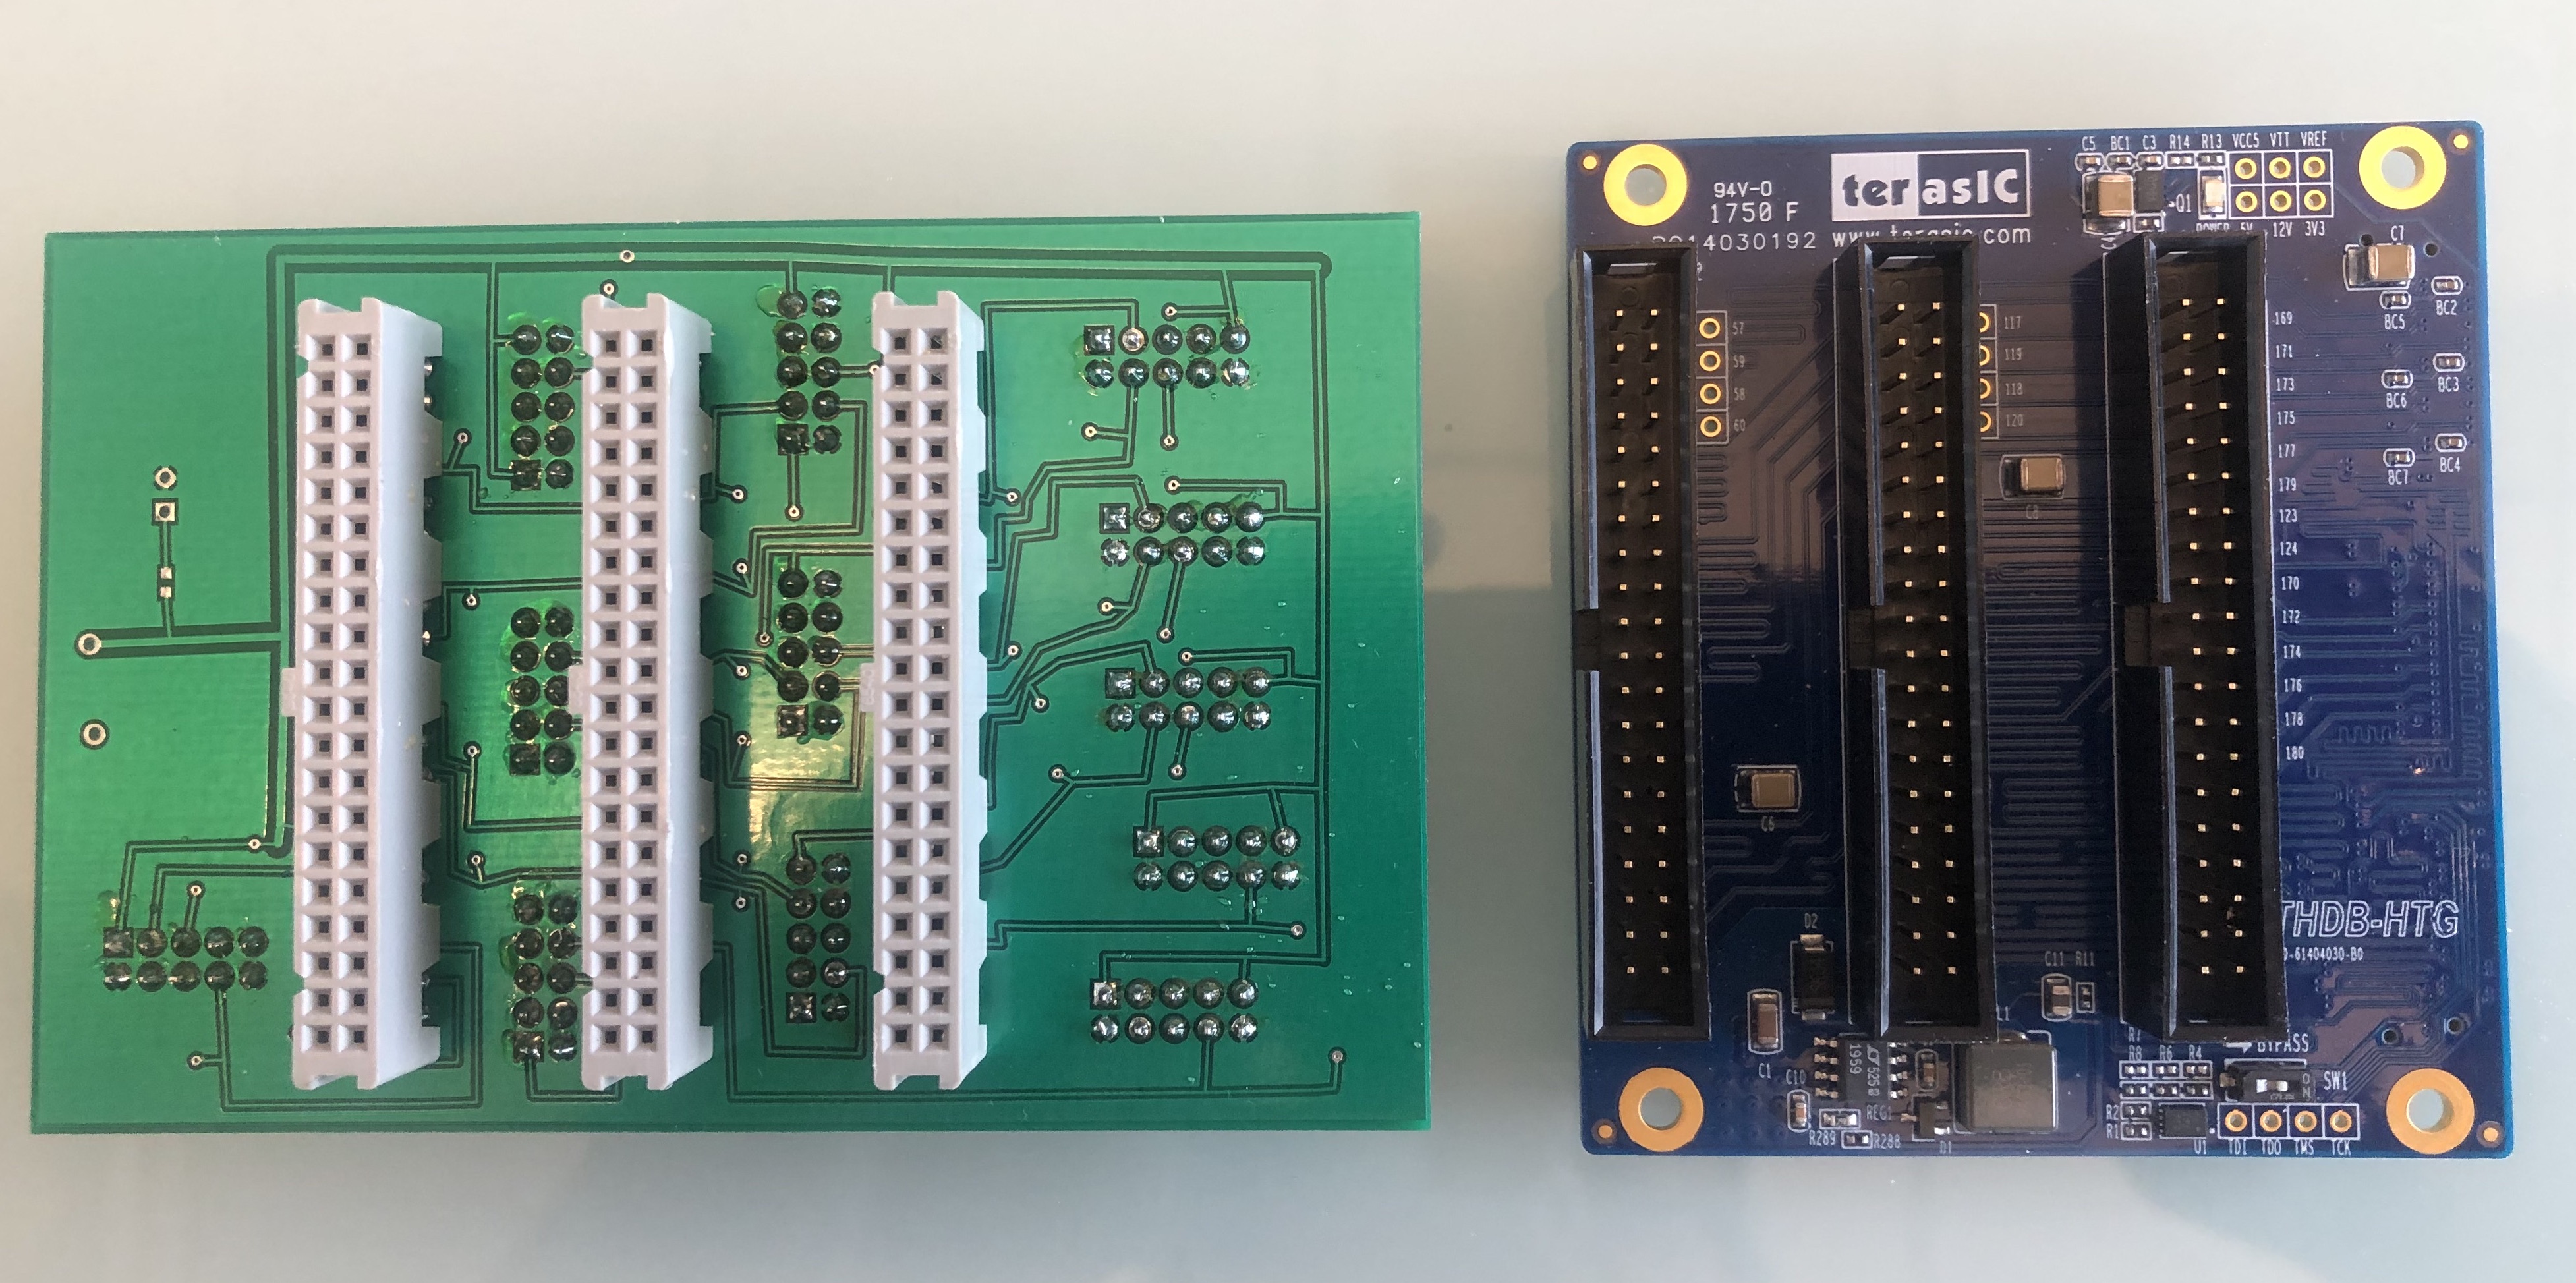
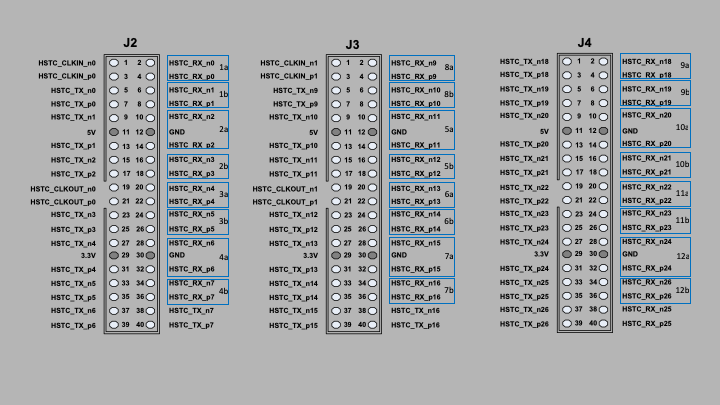
Note: there are 4 HSTC connectors on the DE3, labeled J1, J3, J5, J7. Here is the mapping:
| Bank | Bit | Cat in | Cable | RX_ | HTSC | + | - |
|---|---|---|---|---|---|---|---|
| 1 | 0 | 1 | A | 0 | D | F31 | F32 |
| 1 | 1 | 1 | A | 1 | D | C33 | C34 |
| 1 | 2 | 2 | B | 2 | D | H31 | H32 |
| 1 | 3 | 2 | B | 3 | D | D33 | D34 |
| 1 | 4 | 3 | C | 4 | D | J31 | J32 |
| 1 | 5 | 3 | C | 5 | D | F33 | E34 |
| 1 | 6 | 4 | D | 6 | D | G33 | F34 |
| 1 | 7 | 4 | D | 7 | D | K31 | K32 |
| 2 | 0 | 8 | E | 9 | D | G20 | F20 |
| 2 | 1 | 8 | E | 10 | D | G21 | F21 |
| 2 | 2 | 5 | F | 11 | D | B23 | A23 |
| 2 | 3 | 5 | F | 12 | D | B25 | A25 |
| 2 | 4 | 6 | G | 13 | D | C26 | B26 |
| 2 | 5 | 6 | G | 14 | D | J22 | J21 |
| 2 | 6 | 7 | H | 15 | D | D25 | D24 |
| 2 | 7 | 7 | H | 16 | D | E23 | D23 |
| 5 | 0 | 8 | A | 9 | C | B14 | A14 |
| 5 | 1 | 8 | A | 10 | C | B13 | A13 |
| 5 | 2 | 5 | B | 11 | C | F14 | E14 |
| 5 | 3 | 5 | B | 12 | C | B11 | A11 |
| 5 | 4 | 6 | C | 13 | C | B10 | A10 |
| 5 | 5 | 6 | C | 14 | C | J14 | H14 |
| 5 | 6 | 7 | D | 15 | C | D12 | C12 |
| 5 | 7 | 7 | D | 16 | C | D11 | C11 |
| 6 | 0 | 9 | E | 18 | C | B8 | A8 |
| 6 | 1 | 9 | E | 19 | C | B7 | A7 |
| 6 | 2 | 10 | F | 20 | C | D9 | C9 |
| 6 | 3 | 10 | F | 21 | C | B4 | A4 |
| 6 | 4 | 11 | G | 22 | C | B2 | A2 |
| 6 | 5 | 11 | G | 23 | C | H11 | G11 |
| 6 | 6 | 12 | H | 24 | C | C5 | B5 |
| 6 | 7 | 12 | H | 26 | C | D16 | C16 |
So, to plug in a single double wedge of 16 tubes in such a way that the tubes show up in the code in the right order, here is the sequence:
Note that we only drive the pins labeled "HSTC_RX_n*" and "HSTC_RX_p*". This is because you can't drive the TX lines on the FPGA, those are hard wired to be transmitters, and some of them have their own impedance. Cat added the right input resistors to each of the pair on the UMD board. Back to TOP
To see full scale views of these pictures, click on them.
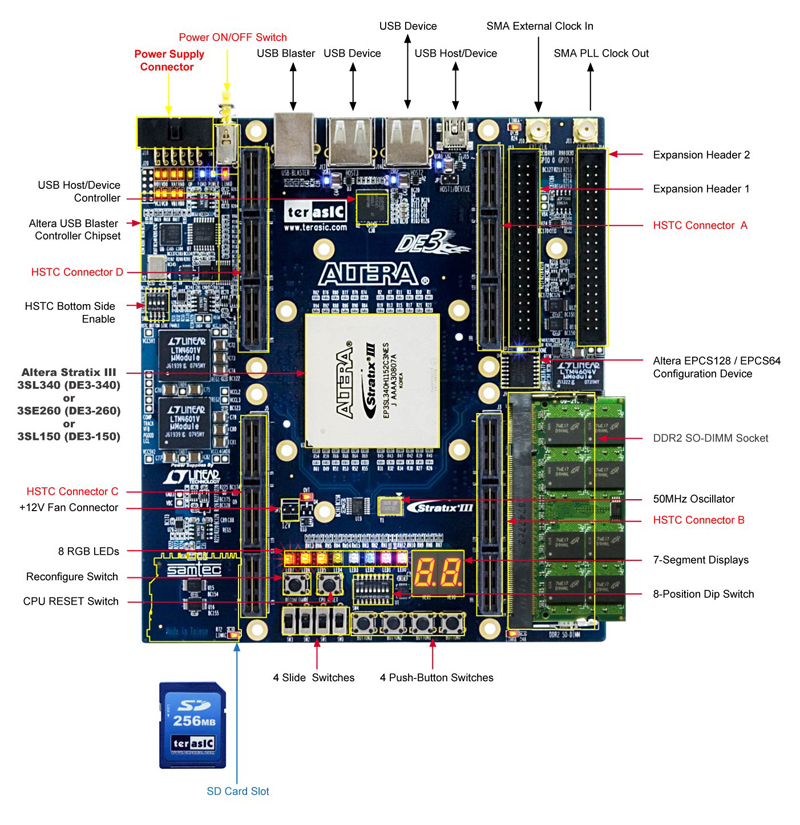
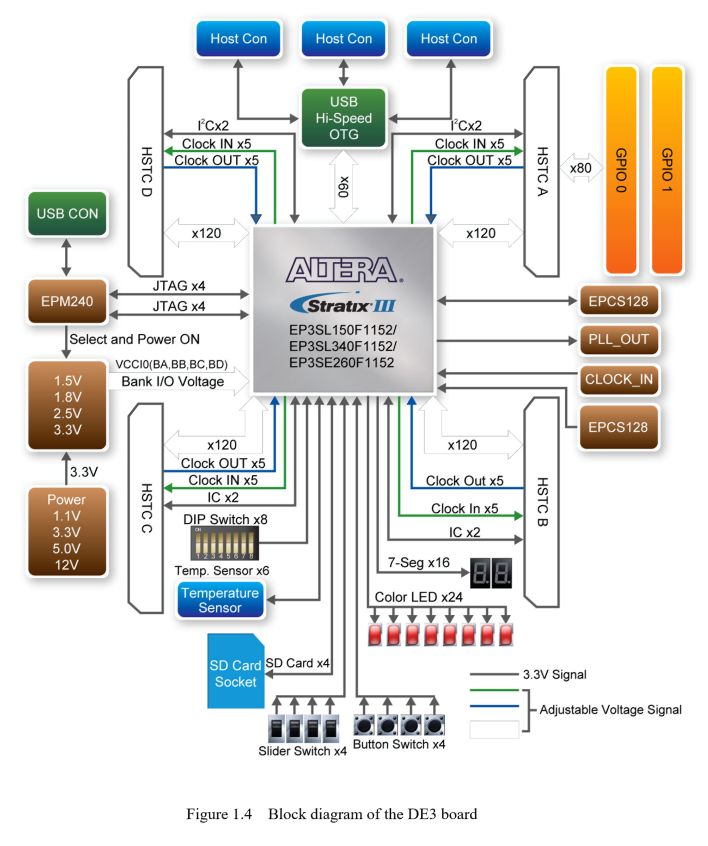
Here is a block diagram of the DE3.

Version 0x50, project rpi_de3_vB, is built to provide an LVDS output signal that can be put into the cable that plugs into UMD adapter board. This allows you to test that each input is getting to the right place.
So far, in that project, we have only implemented 1 of the HTSC connectors, which means we can input from 16 channels (1 "wedge", or 2 "planes"). This input happens on the upper left connector called J1, and that's HSTC D in the manual. It's the one that sits over the power on/off button. For the output, we will use a completely different HTSC, J5, the one right below, and stick a THDB-HTG adapter on top. That HSTC is "HSTC C" in the manual.
Going to the manual, look on page 86. The DE3 is configured so that some of the output pins used for LVDS have this weird termination across the pairs, and you have to us "LVDS_E_1R" as the I/O Standard in the pin assignment tool. This is documented on page 7-36 of the Stratix 3 Handbook (or google "stratix 3 handbook if that link fails"). I think this is because it's using it as a single-ended LVDS output (or something like that). Anyway, to get a pure LVDS output, you are restricted to pins TX_0-8, which are documented on page 86 of the DE3 manual. How did I find this out? Well, I looked at the DE3 schematic, and saw the weird output termination resistors on TX_9 and above, and sure enough the Quartus tool won't let me specify just LVDS, it only allowed LVDS_E_1R (or *3R) if I used one of those. So, for this particular exercise, I have 1 LVDS output, it's using pins TX_p0 (L9) and TX_n0 (L8). On the THDB, these are pins 7(+) and 5(-) respectively, on J2. J2 is the left-most connector, and pin 1 is upper left. (see the figure above by clicking here).
In late July 2019 I added a 2nd LVDS output, so now there are 2. They are:
To test inputs, you can set the mux ("Var1") to 5 and that will put the 8 inputs from "bank1" onto pins gpio[8:1] to look at on the logic analyzer. Var1=6 will put bank2 out, 3 will put out the latched values for bank1, and 4 will put out the latched values for bank2.
The push buttons are active low. There are 4 of them and they do the following
We will use switches [3:0] to control triggering. To describe it, remember we have 4 banks of tubes, labeled 1,2,5,6. 1,2 are on the UPPER, 5,6 on the LOWER. 1 is above 2 and 4 is above 6, offset by half a tube. We will use the symbols "|" and "&" for "or" and "and" of banks, and or1 means at least one it in bank 1. "!" means logical "not". Look in top.v for details.
| sw3,sw2,sw1,sw0 | Trigger | Description |
|---|---|---|
| 0000 | or1 | or2 | or5 | or6 | trigger if any bank has at least 1 hit |
| 0001 | or1 & or6 | UPPER top and LOWER bot |
| 0010 | or1 & or2 & or6 | trigger on plane 1, 2, and 6 (leave out 5) |
| 0011 | or1 & or5 & or6 | trigger on plane 1, 5, and 6 (leave out 2) |
| 0100 | (1&2&5)|(1&2&6)|(2&5&6)|(1&2&5&6) | trigger if there are >2 banks with at least 1 hit (3 or 4) |
| 0101 | (or1 | or2) & (or5 | or6) | a hit in either plane for upper and a hit in either plane for lower |
| 0110 | (or1 & or2) | (or5 & or6) | a hit in both upper or a hit in both lower |
| 0111 | or1 & or2 & or5 & or6 | a hit in all 4 planes |
| 1000 | or1 & or2 & or5 & !or6 | a hit in all planes except 6 |
| 1001 | or1 & or2 & !or5 & or6 | a hit in all planes except 5 |
| 1010 | or1 & !or2 & or5 & or6 | a hit in all planes except 2 |
| 1011 | !or1 & or2 & or5 & or6 | a hit in all planes except 1 |
| 1100,1101,1110,1111 | not used |
| Var | 15 | 14 | 13 | 12 | 11 | 10 | 9 | 8 | 7 | 6 | 5 | 4 | 3 | 2 | 1 | 0 |
|---|---|---|---|---|---|---|---|---|---|---|---|---|---|---|---|---|
| 0 | tx_done | debug_uart[15:12] | rx_data[8] | data_done | rpi_any | state[3:0] | tx1 | rx_dv | rpi_RX | rpi_TX | ||||||
| 1 | lenable | trigger_event | bank2_latch[6:0] | bank1_latch[6:0] | ||||||||||||
| 2 | in_bank2_swap[7:0] | in_bank1[7:0] | ||||||||||||||
| 3 | clock | trigger_event | bank2_latch[4:0] | bank1_latch[7:0] | lenable | |||||||||||
| 4 | clock | trigger_event | bank1_latch[4:0] | bank2_latch[7:0] | lenable | |||||||||||
| 5 | clock | trigger_event | in_bank2_swap[4:0] | in_bank1[7:0] | lenable | |||||||||||
| 6 | clock | trigger_event | in_bank1[4:0] | in_bank2_swap[7:0] | lenable | |||||||||||
| 7 | clock | trigger_event | button3 | button2 | button1 | button0 | switch[3:0] | 0 | orbank12and | orbank12or | orbank2 | orbank1 | lenable | |||
| 8 | clock | trigger_event | 0 | orbank12and | orbank12or | orbank2 | orbank1 | in_bank1[7:0] | lenable | |||||||
| 9 | clock | trigger_event | 0 | orbank12and | orbank12or | orbank2 | orbank1 | in_bank2_swap[7:0] | lenable | |||||||
| A | clock | trigger_event | 0 | lstate[2:0] | bank1_latch[7:0] | lenable | ||||||||||
| B | clock | trigger_event | 0 | lstate[2:0] | bank2_latch[7:0] | lenable | ||||||||||
| C | clock | trigger_event | rdreq_sig | wrreq_sig | read_edge | rdempty_sig | rdfull_sig | wrfull_sig | fifo_data[55:48] | |||||||
| D | read_edge | rdempty_sig | tx1 | rpi_tdata | ndata[7:0] | state[3:0] | ||||||||||
| E | lenable | trigger_event | ~orbank2 | ~orbank1 | fifo_data[5:0] | bank1_latch[3:0] | ||||||||||
| F | lenable | rdreq_sig | q_sig[13:0] | |||||||||||||
Cat Cassell made a very nice adapter that sits on top of the THDB-HTG which sits on top of the DE3 HSTC connector. Whew.
The pinouts of the connector are as described in the following figure, which has a photo of the connector, the pins relative to the notch, and what each pin does.
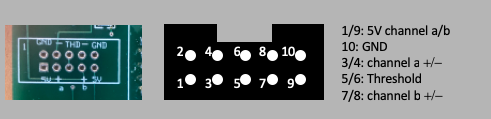
There are 2 important things to remember:
There are 64 tubes in the telescope. The data sent from the FPGA to the RPi will consist of a single bit telling you that there was a signal from the tube. The order of the bits will tell you which tube was hit, so we need a convention. And that convention starts with the firmware.
Connectors
Each of the 8 tubes in a plane is connected to Cat's adapter board by the 10 pin connect. There are 2 tubes per connector since each connector comes from a PMT board that has 2 PMTs. You have to take care that you get the correct tube connected to the correct input, so that the software in the RPi can know what to do with it. So the convention we will use is to TOP and BOT to mean the top or bottom wedges of the telescope (with the sample in the middle). On the TOP we will have 2 wedges, an "X" and a "Y" wedge. It doesn't really matter which is which, not yet anyway, but it will once we start to make precision measurements of the muon position (we will have to know the coordinates of each of the wedges!). And on each wedge, we will have an "upper" and a "lower" plane, which we will label by "U" and "L". On the DE3 board, there will be 3 adapter cards, and each adapter will be able to hold 12 inputs, with 2 each, or 24 each. We only need 64 total, so that means we will fill up the inputs for 2 adapters (48 total) and have the 3rd adapter need only 16, or 8 connector cables.
There are 3 adapter boards, so we label them by their HSTC connector name, which is J7, J5, and J3. Here is the mapping that will be reflected in the firmware and software:
| Plane | 1/2 | 3/4 | 5/6 | 7/8 | Bank, Tubes |
|---|---|---|---|---|---|
| TOP-U-X | J7-A | J7-B | J7-C | J7-D | 1, 1-8 |
| TOP-L-X | J7-E | J7-F | J7-G | J7-H | 2, 1-8 |
| TOP-U-Y | J7-I | J7-J | J7-K | J7-L | 3, 1-8 |
| TOP-L-Y | J5-A | J5-B | J5-C | J5-D | 4, 1-8 |
| BOT-U-X | J5-E | J5-F | J5-G | J5-H | 5, 1-8 |
| BOT-L-X | J5-I | J5-J | J5-K | J5-L | 6, 1-8 |
| BOT-U-Y | J3-A | J3-B | J3-C | J3-D | 7, 1-8 |
| BOT-L-Y | J3-E | J3-F | J3-G | J3-H | 8, 1-8 |
Firmware
In the firmware, the signals come in buses with these names:
	input [7:0] in_bank1,
	input [7:0] in_bank2,
	...
	input [7:0] in_bank8
That makes 8 banks, each with 8 tubes, 64 total. Voila. Then in the firmware, the even banks, which correspond to the lower ("L") planes, are swapped like this:
wire [7:0] in_bank2_swap = {in_bank2[6],in_bank2[7],in_bank2[4],in_bank2[5],in_bank2[2],in_bank2[3],in_bank2[0],in_bank2[1]};
And so when we make the latches, we use in_bank1, in_bank2_swap, in_bank3, in_bank4_swap, etc.
The latches will then come out with the right order. These are labeled like so:
	wire [7:0] bank1_latch;
	wire [7:0] bank2_latch;
	...
	wire [7:0] bank8_latch;
These latches will have a bit set if during the 1 microsec interval the tube had a pulse greater than around 20ns (the internal 50MHz clock period).
The 64 bits of tube data are stored in a fifo that is 1024 deep, in order so that the LSB is tube 1 of TOP-U-X, follwed by 2, 3, ... followed by TOP-L-X, TOP-U-Y, TOP-L-Y, BOT-U-X, BOT-L-X, BOT-U-X, BOT-L-X, all with tubes 1-8 left to right (or right to left, as long as you are consistent). I have put labels on the tubes, 1-8, to reflect this.
There are actually 2 64-bit fifos. One for data, the other one will keep track of the time by storing a 40-bit counter that counts at the clock frequency, which is 50MHz. So each bit means 20ns. 2^40 times 20ns = 2200 sec, which is just over 36 minutes. That's plenty of time so that we don't have to worry about the counter turning over too fast. This may or may not be useful, but it might be used to correlate the muons with other things you may want to do with them later. Anyway I realized after coding it up that the counter is only stored at the 1 microsec boundary of the latch, so it's probably not going to be useful without some verilog changes. Anyway....the 64 bits of data, and the counter info, that go into the 2 fifos will be formatted like this:
	fifo_data <= {	bank8_latch,bank7_latch,bank6_latch,bank5_latch,
					bank4_latch,bank3_latch,bank2_latch,bank1_latch};
	fifo_data_counter <= {nevents_seen[7:0],16'h0,count[39:0]};
You can see that the fifo with the counter will also give you the value of nevents_seen,
which is a counter that counts trigger. It should increment sequentially. If it doesn't,
something went wrong! Also, nevents_seen is only 16 bits so it will turn over after 65535
triggers. Note that after version 0x60, this was changed to record all 16 bits of
nevents_seen:
	fifo_data <= {	bank8_latch,bank7_latch,bank6_latch,bank5_latch,
					bank4_latch,bank3_latch,bank2_latch,bank1_latch};
	fifo_data_counter <= {nevents_seen[15:0],8'h0,count[39:0]};
In the early days of debugging (around version 0x60), we only hooked up 1 wedge, or 2 planes, so we only recorded 2 banks. The format is like this:
	fifo_data <= {
		nevents_seen[15:0],					//63:48
		1'b0,rdempty_sig,rdfull_sig,wrfull_sig,rdempty_sig_c,rdfull_sig_c,wrfull_sig_c,1'b0,  //47:40
		24'h0,								//39:16
		bank2_latch,bank1_latch				//15:0
	};
	fifo_data_counter <= {nevents_seen[7:0],16'h0,count[39:0]};
Software
When the RPi asks for the data, it sends a command to the RPi that says "get ready to send it to me", and then it does a read of 16 bytes, or 128 bits. The data comes back packed such that the data fifo is in bytes 1:8 and the counter fifo in 9:16. The code in the RPi uart subdirectory takes care of this, and it has to do all kinds of Big-Endian/Little-Endian stuff. It was ugly to figure out, but it works so touch it with care. Once the data is received by the RPi, it then unpacks it and puts it into some variables:
So far I've tested 2 of the adapter boards. The one in place now works fine, but the other one has a problem on channel 4 of bank 2, which means channel 6b, or channel 2 of cable F. That board is sitting on the power supply waiting to be debugged!
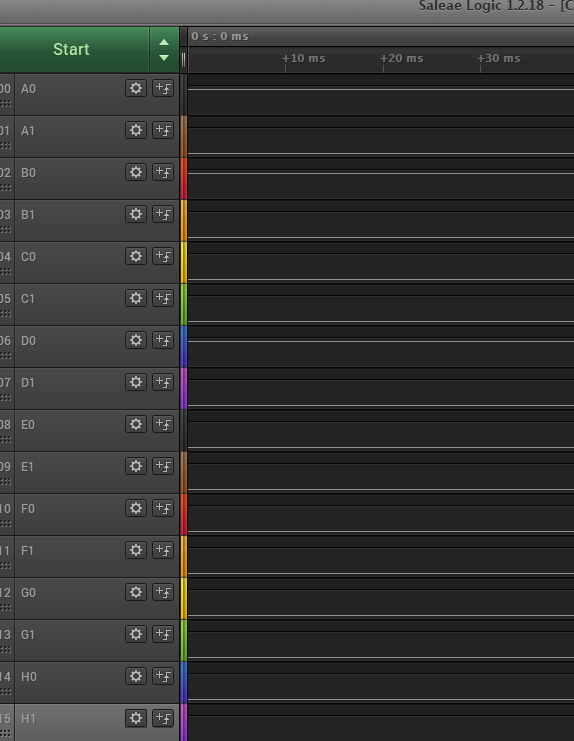
Try again with the above steps to check things out. Start with var1=2 to see if the TOP PMT cables are ok....no power on the LV side...a few channels are high. So it's probably that without power, things are floating. Power on, 5V and -3V threshold. Recheck....channels 0 and 1 are high. These should be the 2 inputs from cable A. Recheck, still high. Swap A and B...whoops, forgot to load var1=2. Ok, now all is quiet on the top. check BOT by load var1=3. Looks like this:
Try swapping the cables A and C...same picture. So it's something either on the adapter board, or in the FPGA. Maybe I have the wrong inputs?
Swapped out the THDB-HTG board with another. Recheck.
Ok, I think I had completely wrong assignments for the bottom 16. Changing...new version will be 0x72. Testing....ok, it now works, all channels appear quiet. No time to do a muon run (would mean turning on HV)...
Recheck....banks 1,2,5 and 6 are still quiet. Fire up banks 1/2 to 900V...look at the logic analyzer (var1=2)...nothing. Powercycle the DE3....all lights start to blink on and off. Uh oh... remove the 2nd adapter board and now it powers up ok. Set var1=2 and check the logic analyzer....all channels are low. WTF.
Changed THDB cards and replaced adapter, voltage to 900V. Ok, now I see signals on banks 1/2:
Now reattach banks 5/6....reset voltage to 900 on banks 1/2 only. Remeasure, see 7 coincidences in 2 sec. Good enough.
Now set the voltage to 5/6 also to 900 V. Both power supplies read 5.7A, which is good! Change var1=3, look at logic analyzer. And the answer is...nothing! Argh! That both power supplies read the same current probably means that they are both connected, so I don't have to check that (maybe later). I suspect that I haven't built the fw correctly. First thing to do is to swap the adapter boards...but that won't work unless I also swap the cables. TBC....
Found a bad adapter board. By the way, the cosmic ray muon flux at sea level is around 1 per cm^2 per minute, with an energy averaging around 4 GeV. Our gadget has an area of 19 x 26 = 490 cm^2, so we expect around 490/min = 8/sec.
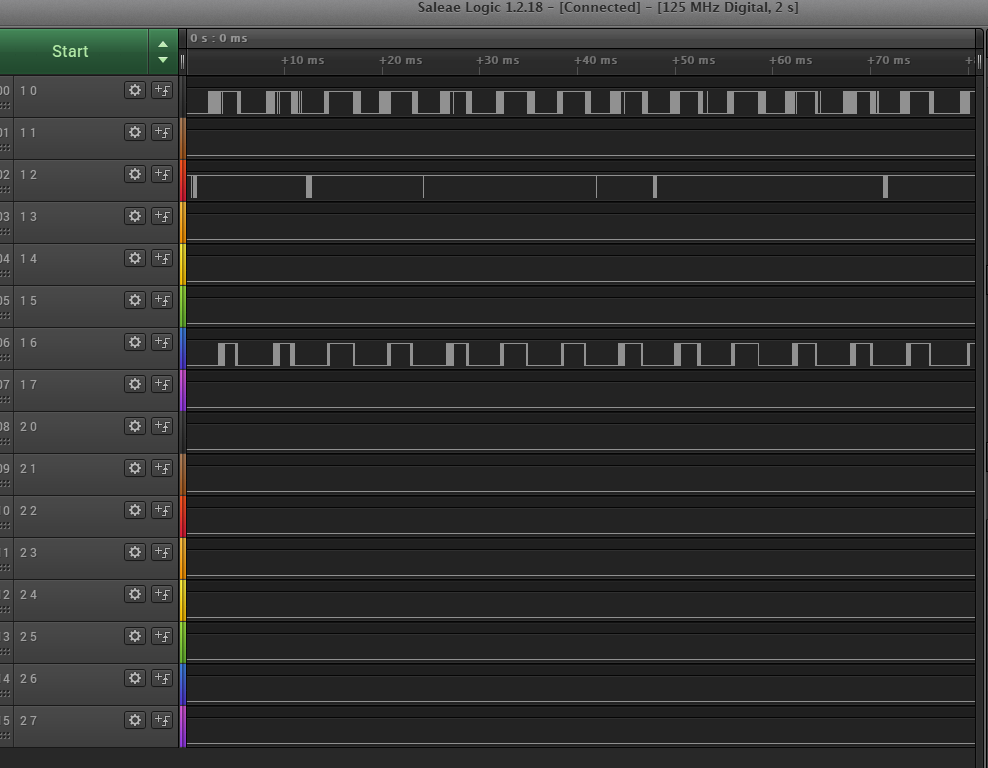
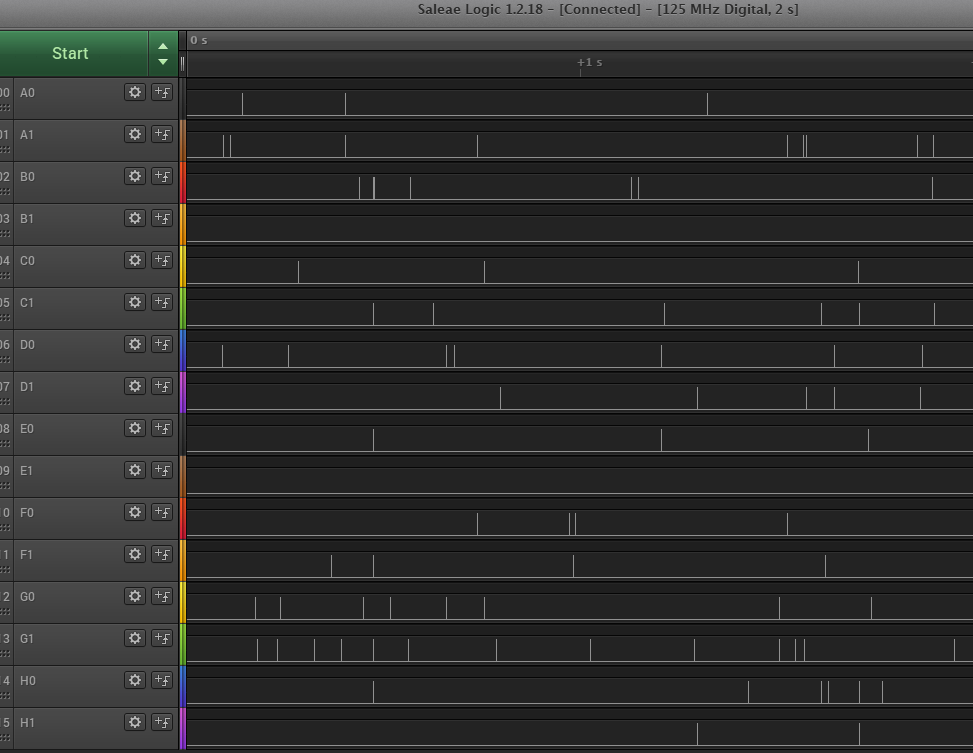
Ok, plug 2 adapter boards, set THD to 3V and HV to 900 V. Note that on the little RIGOL power supplies, the 5V supplie reads 0.33 amps, which is about right. Below are screen shots from the logic analyzer. This is what we expect:
| Upper | Lower |
|---|---|
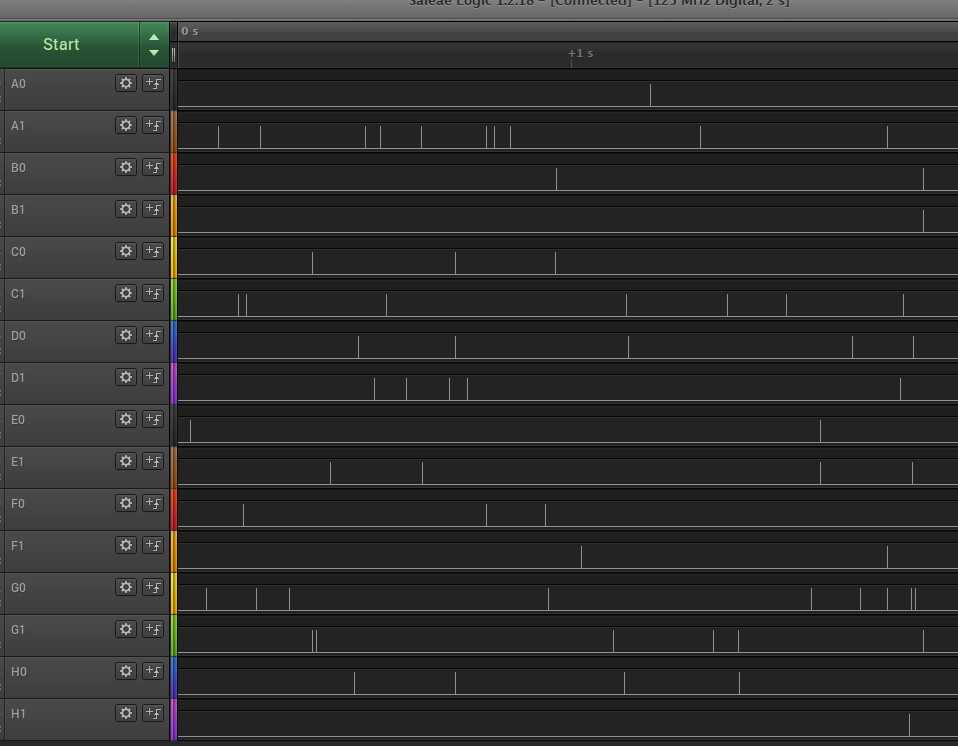
| 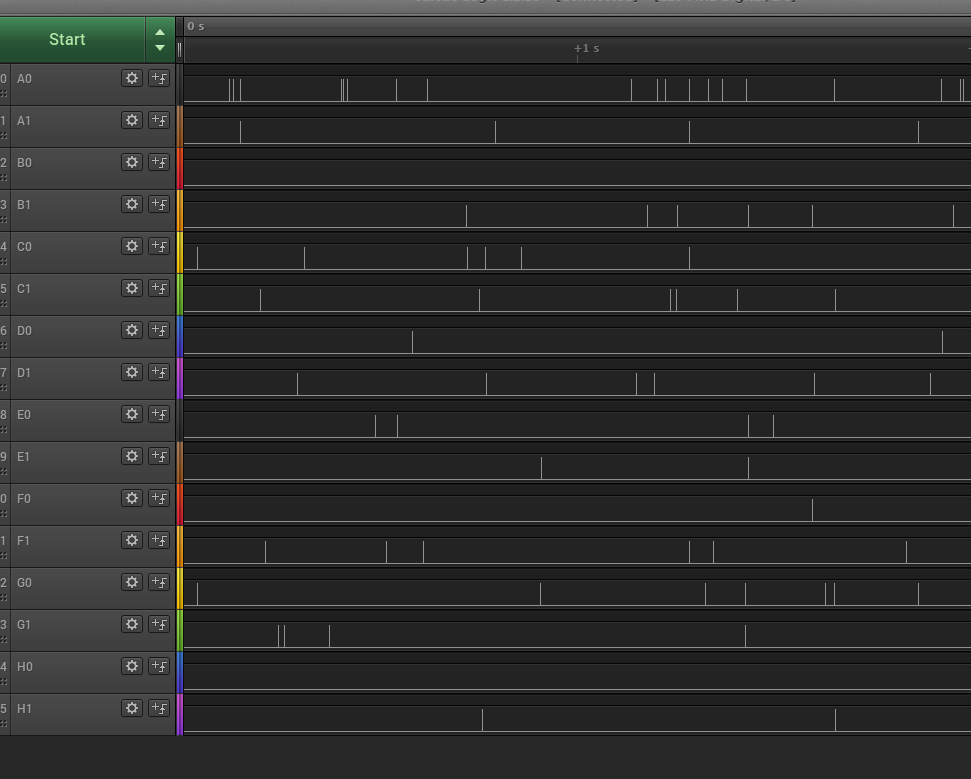
|
The logic analyzer allows you to store the data in csv format. I made a new directory in \Drewbox\PC_Stuff\Telescope\Data to store them. Anyway I see 8 times there were coincidences in upper and 3 in lower, in 2 sec. That's consistent with the above 8/sec because 1) statistics are small, and 2) the efficiency of capturing things on a LA and the efficiency of the detector is likely not 100%.
Configuration:
Test with no voltage passes (do this with low voltage on, and send var1=2 and var1=3 successfully, with a logic analyzer reading after each setting). All channels read logic 0.
Fire up HV. Do the var1=2 and 3 test. Looks good, all channels look like the picture in the entry for 11/7/19. Now start a run.... rate is very low, about 1 event every 7 or 8 sec. Will check with Sarah Eno, maybe this is just the way it is. Anyway, I think there IS a problem. When I look at all of the events, the all have 1 upper plane and 1 lower, but none of the first 15 events have hits in BOTH upper or BOTH lower. Hmmm....this might mean that we are not seeing real muons.
Try changing the bit switches to {110}, which means a hit in both upper OR both lower. 7 hits in 30 sec. Hmm, some of them do indeed have hits in both layers that are right on top of each other. But not all. Time to write some code to save these events onto disk so that we can read them back in and have a look later....this will be version 11 of the Controller. TBC....
...Sarah Eno confirms that when she did muon runs before with counters that have similar attributes, she ran for order a day. I think we are in the right ballbark then and we are seeing muons. But I still want to figure out why there are no double hits for trigger condition {101}...
I think we are done, except I still want to do a test where I modify the fw so that whenever it gets a trigger, it sends the signals out the logic analyzer port. What I want to do is see why with the trigger set to OR of the top AND OR of the bottom wedge, when we get events there's usually (90% or more) only 1 PMT hit in the top (out of 16) and 1 in the bottom. That's weird. Gotta make sure there's no bug.
Do some checking on the trigger rate. Set the trigger bits to trigger on the or of a single plane, save the data to disk, measure the rate. First, start with upper wedge only. Turn HV off the lower wedge. Check var1=2 and 3 w logic analyzer. OK. Set trigger bits to 101 (2 on upper or 2 on lower). Do a run and wait for 10 events, set latch window to 1us. Took 95 sec. Now do a run with HV off on upper and on on lower. Start a run, wait for 10 events. This took twice as long, 172 seconds. Hmm...
We can measure each plane separately.
| top upper | 20 events, 13 sec |
| bot upper | 20 events, 19 sec |
| top lower | 20 events, 18 sec |
| bot lower | 20 events, 18 sec |
Ok, let's take some data. Put HV=900 on all tubes and trigger on each layer separately for 30 sec. Record data and move to /home/pi/work and create a spreadsheet called analysis1.xlsx in the analysis area on DROPBOX. Note that the files copy_work and copy_software (on the RPI) copies the /home/pi/work and home/pi/uart to the Telescope area in DROPBOX.
Ok, here is the result of that analysis:
| U/L | T/B | 1 | 2 | 3 | 4 | 5 | 6 | 7 | 8 |
|---|---|---|---|---|---|---|---|---|---|
| upper | top | 20 | 16 | 0 | 20 | 16 | 9 | 4 | 13 |
| upper | bot | 9 | 0 | 3 | 6 | 7 | 11 | 0 | 1 |
| lower | top | 5 | 15 | 3 | 2 | 5 | 8 | 15 | 9 |
| lower | bot | 3 | 6 | 6 | 5 | 18 | 17 | 2 | 1 |
Upper top channel B1 (3rd tube) has no hits. Replaced PMT board and now it seems to be ok. Did a 58 sec run:
| U/L | T/B | 1 | 2 | 3 | 4 | 5 | 6 | 7 | 8 |
|---|---|---|---|---|---|---|---|---|---|
| upper | top | 22 | 11 | 9 | 15 | 19 | 4 | 0 | 5 |
| U/L | T/B | 1 | 2 | 3 | 4 | 5 | 6 | 7 | 8 |
|---|---|---|---|---|---|---|---|---|---|
| upper | top | 21 | 6 | 9 | 17 | 15 | 6 | 2 | 1 |
| U/L | T/B | 1 | 2 | 3 | 4 | 5 | 6 | 7 | 8 |
|---|---|---|---|---|---|---|---|---|---|
| upper | top | 23 | 14 | 1 | 8 | 17 | 10 | 19 | 9 |
| U/L | T/B | 1 | 2 | 3 | 4 | 5 | 6 | 7 | 8 |
|---|---|---|---|---|---|---|---|---|---|
| upper | top | 22 | 10 | 20 | 15 | 9 | 17 | 3 | 12 |
| U/L | T/B | 1 | 2 | 3 | 4 | 5 | 6 | 7 | 8 |
|---|---|---|---|---|---|---|---|---|---|
| upper | top | 21 | 11 | 14 | 14 | 15 | 14 | 3 | 4 |
Now debug the upper bottom. Set the trigger to 010 and take 60 sec:
| U/L | T/B | 1 | 2 | 3 | 4 | 5 | 6 | 7 | 8 |
|---|---|---|---|---|---|---|---|---|---|
| upper | bot | 12 | 0 | 0 | 6 | 5 | 6 | 3 | 1 |
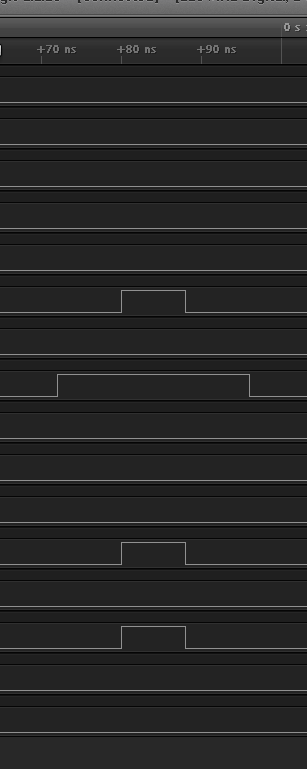 Ok, crank voltage up to 950V. Visual inspection of the logic analyzer
shows it's much better. There are lots of 8ns pulses, but many more
16ns and 24ns, but that's because the logic analyzer clock is 125MHz,
which is 8ns. The DE3 clock is 50MHz, or 20ns. The latch module uses
the posedge of that clock. Let's see if I can double the frequency
using some kind of clock multiplier....nope, the Stratix III doesn't
seem to have
a PLL in it (checking with the Altera FAE)
so it can't make a clock multiplier. Maybe later....crank up the voltage
to 1000V and I can see some muons but still with 8ns width. Need a
100MHz clock. Later....
Ok, crank voltage up to 950V. Visual inspection of the logic analyzer
shows it's much better. There are lots of 8ns pulses, but many more
16ns and 24ns, but that's because the logic analyzer clock is 125MHz,
which is 8ns. The DE3 clock is 50MHz, or 20ns. The latch module uses
the posedge of that clock. Let's see if I can double the frequency
using some kind of clock multiplier....nope, the Stratix III doesn't
seem to have
a PLL in it (checking with the Altera FAE)
so it can't make a clock multiplier. Maybe later....crank up the voltage
to 1000V and I can see some muons but still with 8ns width. Need a
100MHz clock. Later....
	0-4   ==================
	4-8   ====
	8-16  ====
	16-20 ==========
	20-24 ==
	24-28 =
	28-32
	32-36
	36-40
	40-44 =
Kind of interesting. Now let's do the same thing only have 3 tubes on the top and 3 on the bottom (the logic analyzer can sample only 6 at 500MHz) and look for coincidences. Here's the histogram of pulse width for those pulses that are in time (to the ns) with others.
	0-4   ====
	4-8   =====
	8-16  =====
	16-20 ===
	20-24 ======
	24-28 =
	28-32
	32-36 =
	36-40 =
	40-44
It really looks different, like some of the very short pulses are noise. Which makes sense. It would be nice if I could figure out a way to read out the widths of pulses from any given channel, which might be possible but it would mean counting clock ticks, recording the value, etc. Meanwhile, I will try something else: change the threshold to 2.0V and see what happens:
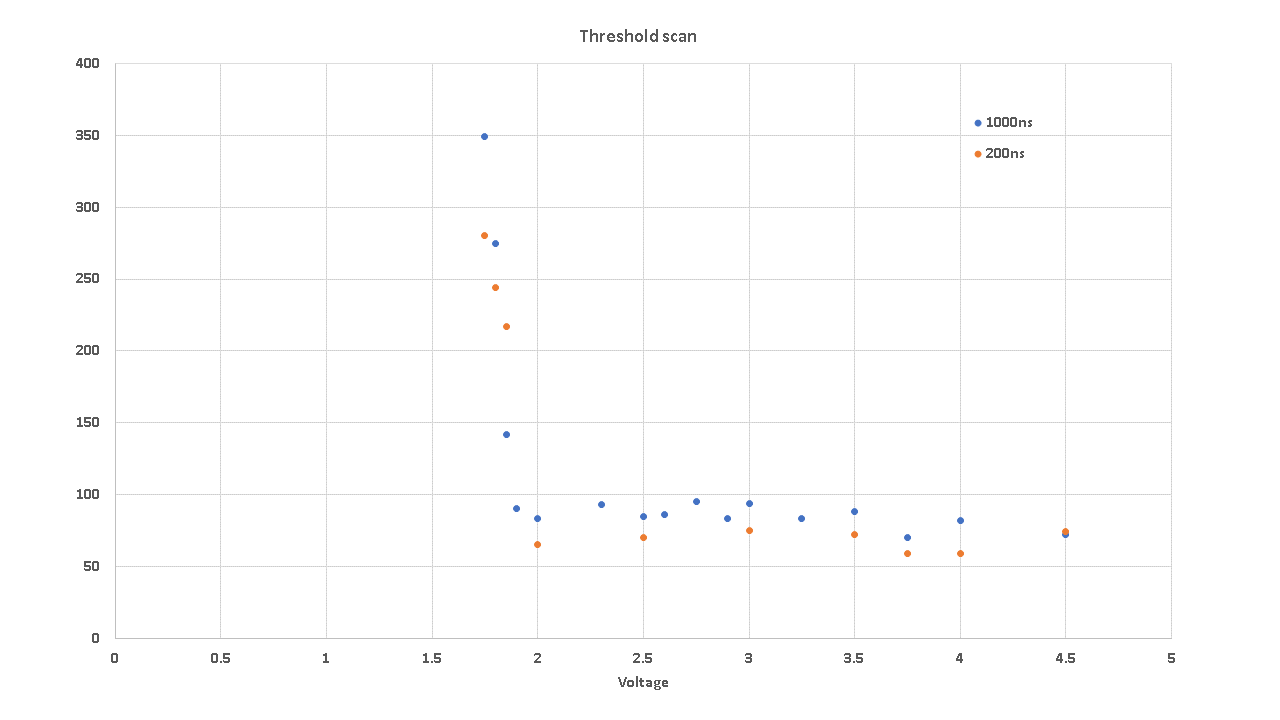
Here are the results for number of events in 60 sec vs threshold voltage, at HV=950V with a 1us latch window:
	 4.5   72
	 4.00  82
	 3.75  70
	 3.5   88
	 3.25  83
	 3.0   94
	 2.9   83
	 2.75  95
	 2.6   86
	 2.5   85
	 2.3   93
	 2.0   83
	 1.9   90
	 1.85  142
	 1.8   275
	 1.75  349
Now let's repeat those measurements but use a 200ns latch window.
	 4.5   74
	 4.00  59
	 3.75  59
	 3.5   72
	 3.25
	 3.0   75
	 2.9
	 2.75
	 2.6
	 2.5   70
	 2.3
	 2.0   65
	 1.9
	 1.85  217
	 1.8   244
	 1.75  280
Here's the plot:
Found a bug in the code, so fixing it with version 0x75. This will allow triggering on events with a hit in all 4 planes. Downloaded. Here's what I get for the number of triggers in 60 sec: 15 events. This might very well be the right number!
Thinking about adding code to fifo pulse widths and read out. Might be interesting.....enough for today...
Working on new FW to measure pulse width. Meanwhile, time to check the mapping. Keep power off on the lower wedge, and disconnect all HV except for 1 pair. Let 1 PMT see the light but put a piece of tape over the other. HV set to 950V. This way we will see only 1 at a time. Look for triggers and events and use the event display to make sure that only 1 fires at a time (set switches to all 000) and it's in the right place in the event display.
Cable A, tube 1, 2, 5, 6, hmm, 3 and 4 are reversed. Hmmm, ah, I'm such an idiot! Tubes 1 and 2 are on the same cable, on the left side of the plane, but 3 and 4 are on the right side. So it's not only that the bottom plane is reversed, but the pairs are reversed. So it goes like this:
Cable A, top tube 0,1, signals are ok
Cable B, top tube 2,3, signals are reversed
Cable C, top tube 3,4, ok
Cable D, top tube 5,6, reversed
And it's the same for all planes due to the symmetry (stare at it, you'll
see!)
Cooking up new few, area rpi_de3_v10, new version will be 0x77. Works great.
Todo:
11/27/19
Took the 2 boxes and made 1 big one so that I can stack the UPPER and LOWER closer (now 5 inches apart). Set HV to 950, latch width 1us, threshold 2.5V, trigger on "UPPERor & LOWERor" (101 on the switches). I get some nice events, but many have only 1 in UPPER and 1 in LOWER, or 1 and 2. I need a trigger that will require 3 out of 4, then I can measure the efficiency. I also need to finish the FW that allows me to fifo and read the pulse width. But all in all, it looks pretty good. So, todo list:
New fw for the >2 planes trigger cooking, v 0x78. Out of gas, going home.
Several problems to look at. the first one is that when I turn off HV on all but the right most tubes of plane 2 and 6 (UPPER bot and LOWER bot) and put tape on the outer tube, and trigger on any tube firing, I see something peculiar: UPPER bot tube 7 fires most of the time, but sometimes tube 8 first. Huh? This could be a bug in the code, it could also be transfer errors. So I will look into whether I can add a parity bit to the transfer and the RPI can handle it. I did a run and got around 100 events and saw the following:
Read 103 events
Bank1 tubes 1-8: [0, 0, 0, 0, 0, 0, 0, 0]
Bank2 tubes 1-8: [0, 0, 0, 0, 0, 0, 90, 8]
Bank5 tubes 1-8: [0, 0, 0, 0, 0, 0, 0, 0]
Bank6 tubes 1-8: [0, 0, 0, 0, 0, 0, 6, 0]
That most of the firing are with the UPPER bot 7 tube, and there were almost 10% UPPER bot 8, well that's a problem. Next I moved to FW 0x80 out of rpi_de3_v11 directory. This has the pulse width additions. When I ran this fw on 100 events, here's what I see:
Read 107 events
Bank1 tubes 1-8: [0, 0, 0, 0, 0, 0, 0, 0]
Bank2 tubes 1-8: [0, 0, 0, 0, 0, 0, 104, 1]
Bank5 tubes 1-8: [0, 0, 0, 0, 0, 0, 0, 0]
Bank6 tubes 1-8: [0, 0, 0, 0, 0, 0, 2, 0]
Not good. Try another run just to be sure....
Read 85 events
Bank1 tubes 1-8: [0, 0, 0, 0, 0, 0, 0, 0]
Bank2 tubes 1-8: [0, 0, 0, 0, 0, 0, 83, 1]
Bank5 tubes 1-8: [0, 0, 0, 0, 0, 0, 0, 0]
Bank6 tubes 1-8: [0, 0, 0, 0, 0, 0, 1, 0]
Now I have to debug this. First will move from tube 7 to 8 and see what happens:
Read 315 events
Bank1 tubes 1-8: [0, 0, 0, 0, 0, 0, 0, 0]
Bank2 tubes 1-8: [0, 0, 0, 0, 0, 0, 4, 106]
Bank5 tubes 1-8: [0, 0, 0, 0, 0, 0, 0, 0]
Bank6 tubes 1-8: [0, 0, 0, 0, 0, 0, 0, 208]
So I am still getting hits in UPPER bot 7, but now LOWER bot has way more than UPPER bot. Let's try swapping the PMT board in LOWER BOT, maybe there's a problem with it....
Read 99 events
Bank1 tubes 1-8: [0, 0, 0, 0, 0, 0, 0, 0]
Bank2 tubes 1-8: [0, 0, 0, 0, 0, 0, 4, 95]
Bank5 tubes 1-8: [0, 0, 0, 0, 0, 0, 0, 0]
Bank6 tubes 1-8: [0, 0, 0, 0, 0, 0, 0, 0]
Ok, probably is still there. Worse now. Investigating....swapped the PC boards, UPPER bot with LOWER bot....
Read 92 events
Bank1 tubes 1-8: [0, 0, 0, 0, 0, 0, 0, 0]
Bank2 tubes 1-8: [0, 0, 0, 0, 0, 0, 0, 0]
Bank5 tubes 1-8: [0, 0, 0, 0, 0, 0, 0, 0]
Bank6 tubes 1-8: [0, 0, 0, 0, 0, 0, 0, 92]
Well, I think that tells me it's the PC board. Maybe I swapped in a bad one. Try another...
Read 72 events
Bank1 tubes 1-8: [0, 0, 0, 0, 0, 0, 0, 0]
Bank2 tubes 1-8: [0, 0, 0, 0, 0, 0, 52, 0]
Bank5 tubes 1-8: [0, 0, 0, 0, 0, 0, 0, 0]
Bank6 tubes 1-8: [0, 0, 0, 0, 0, 0, 0, 21]
Ok, that was it, 2 bad boards. I still don't like the big difference in rate though, so will do a longer run, say 180 sec (previous one was around 50sec):
Read 565 events
Bank1 tubes 1-8: [0, 0, 0, 0, 0, 0, 0, 0]
Bank2 tubes 1-8: [0, 0, 0, 0, 0, 0, 400, 0]
Bank5 tubes 1-8: [0, 0, 0, 0, 0, 0, 0, 0]
Bank6 tubes 1-8: [0, 0, 0, 0, 0, 0, 0, 168]
Still there. Swap tubes so we should see UPPER bot 8 and LOWER bot 7 fire, and do another run:
Read 146 events
Bank1 tubes 1-8: [0, 0, 0, 0, 0, 0, 0, 0]
Bank2 tubes 1-8: [0, 0, 0, 0, 0, 0, 0, 145]
Bank5 tubes 1-8: [0, 0, 0, 0, 0, 0, 0, 0]
Bank6 tubes 1-8: [0, 0, 0, 0, 0, 0, 0, 1]
Damn, it's back. And that means that it's NOT the PC board, and it's not the tube. Maybe it's the cable. So I'll swap that and see what happens:
Read 108 events
Bank1 tubes 1-8: [0, 0, 0, 0, 0, 0, 0, 0]
Bank2 tubes 1-8: [0, 0, 0, 69, 0, 0, 0, 0]
Bank5 tubes 1-8: [0, 0, 0, 0, 0, 0, 0, 0]
Bank6 tubes 1-8: [0, 0, 39, 0, 0, 0, 0, 0]
I think the cable to LOWER bot 7 and 8 must be bad. I noticed that the cables were tangled around the LV terminals, I wonder.... swapping back to normal and remeasure....
Read 99 events
Bank1 tubes 1-8: [0, 0, 0, 0, 0, 0, 0, 0]
Bank2 tubes 1-8: [0, 0, 0, 0, 0, 0, 0, 98]
Bank5 tubes 1-8: [0, 0, 0, 0, 0, 0, 0, 0]
Bank6 tubes 1-8: [0, 0, 0, 0, 0, 0, 0, 1]
Problem is back. Must be the cable. But to make sure it's the cable and not anything else, I will swap the cable at the adapter board on the FPGA and remeasure....the rate is MUCH higher now. And the answer is...
Read 159 events
Bank1 tubes 1-8: [0, 0, 0, 0, 0, 0, 0, 0]
Bank2 tubes 1-8: [0, 0, 0, 0, 0, 0, 0, 118]
Bank5 tubes 1-8: [0, 0, 0, 0, 0, 0, 0, 0]
Bank6 tubes 1-8: [0, 0, 0, 0, 1, 40, 0, 0]
Ok, I understand why I see hits in tube 6, it's because of the "every other" PC board symmetry change. So my conclusion is that it IS the cable. Swap back and measure again...problem is back (no need for printout).
But now, I can measure the pulse width! Note that the new RPI code to use is v13. To do this: set var2, which determines which pulse to mux. UPPER bot 7 and LOWER bot 8 are the 2 tubes. The mux that sends the tube pulse to the width measurer circuit determines which tube to measure.
Another problem: when I run a trigger of 3 out of 4, it just seems as if the muons do not line up sufficiently. This could be anything, so I will check the mapping first.
Out of gas, going home. Todo:
Remade the box, put a door on the front to make it easier to access. Still might need a black cloth cover on the front or back, will try to check that out later. Replaced cable H on the lower.
Read 239 events
Bank2 tubes 1-8: [0, 0, 0, 0, 0, 0, 0, 169]
Bank6 tubes 1-8: [0, 0, 0, 0, 0, 0, 0, 70]
Ok, that looks better. Still x3 more events on the top.
Next, test lights on vs lights off. Run for 60 seconds:
Read 166 events
Bank2 tubes 1-8: [0, 0, 0, 0, 0, 0, 0, 117]
Bank6 tubes 1-8: [0, 0, 0, 0, 0, 0, 0, 51]
Now, lights off:
Read 193 events
Bank2 tubes 1-8: [0, 0, 0, 0, 0, 0, 0, 149]
Bank6 tubes 1-8: [0, 0, 0, 0, 0, 0, 0, 46]
Looks the same. Try lights on again to be sure:
Read 167 events
Bank2 tubes 1-8: [0, 0, 0, 0, 0, 0, 1, 124]
Bank6 tubes 1-8: [0, 0, 0, 0, 0, 0, 0, 44]
Ok, I conclude that we can now work with the lights on in the room.
Found some bad PMT boards (left them inside the enclosure), 1 bad PMT (put it in a box and labeled it "BAD"), fixed some cables. Sheesh. Did a run for 24 seconds with trigger condition "ANY" and see this:
Read 1470 events
Bank1 tubes 1-8: [49, 105, 23, 76, 46, 73, 92, 117]
Bank2 tubes 1-8: [48, 0, 53, 32, 81, 99, 61, 59]
Bank5 tubes 1-8: [79, 31, 70, 30, 104, 90, 77, 37]
Bank6 tubes 1-8: [14, 41, 30, 57, 13, 40, 21, 25]
Ok, that's a good place to stop. Clearly there are some issues (Bank 2 tube 2 seems to be dead, and bank 1 butes 2 and 8 seem to be hyperactive). It could be that some of these tubes have much higher gain than others, in which case we can play with the threshold. Anyway....
Here's the TODO list:
Pearl Harbor Day. Makes me ill thinking about World War 2. But that's another story.
Ok, did a run for 38 seconds with trigger condition "ANY". Here's what I see:
Read 2563 events
Bank1 tubes 1-8: [68, 250, 31, 120, 61, 108, 236, 228]
Bank2 tubes 1-8: [67, 0, 84, 72, 129, 178, 68, 100]
Bank5 tubes 1-8: [118, 55, 116, 63, 159, 132, 119, 56]
Bank6 tubes 1-8: [22, 59, 76, 100, 18, 73, 31, 48]
Now I have the software ready to make plots of the pulse widths. First you have to set the channel you want to mux. You can do this by inputting a bank (1-8) and channel number (1-8, decimal integer) next to "Mux bank:" and "chan:", and hit "Set", or write the hex equivalent to "Var2". (You can send a hex representation of the value 8*(b-1)+(ch-1) to var2.) Then hit the "Reset" button to reset the fifo in case there were values in there from a different channel. Note that in 38 seconds you get somewhere between 0 and 10 hits so you need to wait to accumulate. If you hit "Read All" (the one to the right of "Pulse width") it will make a histogram. You can keep hitting "Read All" and it will add to the previous histogram. Hit "Clear" to clear it when you want to start over (like with another channel)
Out of gas. When I get back I will take a look at all the channels.
Modified the FW so that the pulse width fifo is only written to when the system "START" has been issued (it's bit 0 of CSR).
We checked the mapping and it all looked ok. Then we put everything back after putting silvered tin foil on the ends of all scintillators for the 2 wedges to make sure all photons get counted. Then we measured the rates after 60 seconds and got this:
Read 14498 events
Bank1 tubes 1-8: [150, 2015, 60, 551, 137, 317, 1599, 2008]
Bank2 tubes 1-8: [2428, 330, 82, 87, 528, 223, 140, 263]
Bank5 tubes 1-8: [1196, 109, 475, 79, 76, 229, 962, 106]
Bank6 tubes 1-8: [43, 115, 53, 63, 31, 75, 591, 105]
We added silver reflector at the end of each scintillator, opposite the PMT, and rebuilt the setup. To confirm previous run, after 30 sec we see this kind of rate:
Read 13825 events
Bank1 tubes 1-8: [85, 2660, 34, 560, 61, 302, 1524, 1652]
Bank2 tubes 1-8: [2048, 330, 74, 81, 393, 135, 74, 132]
Bank5 tubes 1-8: [2369, 44, 345, 42, 27, 142, 458, 51]
Bank6 tubes 1-8: [20, 63, 28, 52, 17, 46, 320, 61]
This confirms the problem. Try shutting off the lights and try again:
Read 10053 events
Bank1 tubes 1-8: [73, 1806, 30, 387, 79, 234, 1131, 1069]
Bank2 tubes 1-8: [1460, 251, 58, 81, 300, 119, 64, 98]
Bank5 tubes 1-8: [1884, 50, 282, 44, 15, 136, 194, 43]
Bank6 tubes 1-8: [18, 63, 25, 48, 14, 34, 246, 53]
Hmm, slightly better. Now try putting a single black cloth over the rear part of the box and rerun:
Read 1777 events
Bank1 tubes 1-8: [55, 93, 44, 68, 58, 75, 95, 121]
Bank2 tubes 1-8: [126, 66, 28, 28, 110, 107, 59, 81]
Bank5 tubes 1-8: [89, 45, 98, 32, 37, 65, 127, 50]
Bank6 tubes 1-8: [19, 55, 20, 27, 15, 42, 129, 61]
Ok, looks like there's a light leak in the back somewhere. Add more black cloth and rerun
Read 1785 events
Bank1 tubes 1-8: [44, 95, 32, 68, 51, 83, 107, 125]
Bank2 tubes 1-8: [108, 66, 25, 34, 106, 91, 63, 78]
Bank5 tubes 1-8: [109, 49, 106, 33, 29, 77, 126, 58]
Bank6 tubes 1-8: [25, 60, 22, 32, 25, 54, 132, 75]
Looks like it's a problem on the back. Whew!
I made a spreadsheet that can take a data file and break it up into which tubes fired, so we can analyze it. See Dropbox/PC_Stuff/Telescope/analysis and look for the file 2019.Dec.27.1301.xlsx. It shows the following for the 4 banks:
| Bank | Events | 1 | 2 | >2 |
|---|---|---|---|---|
| 1 | 1785 | 531 | 34 | 2 |
| 2 | 1785 | 509 | 25 | 3 |
| 5 | 1785 | 520 | 32 | 1 |
| 6 | 1785 | 362 | 30 | 1 |
This looks pretty good, and I would say pretty well balanced except for the bottom layer. Let's take another run and see if it's just statistics:
Read 1794 events
  Bank1 tubes 1-8: [59, 100, 28, 76, 46, 101, 109, 133]
  Bank2 tubes 1-8: [135, 71, 27, 27, 95, 111, 61, 73]
  Bank5 tubes 1-8: [120, 47, 95, 43, 21, 77, 103, 57]
  Bank6 tubes 1-8: [21, 72, 15, 23, 14, 36, 115, 62]
| Bank | Events | 1 | 2 | >2 |
|---|---|---|---|---|
| 1 | 1794 | 581 | 34 | 1 |
| 2 | 1794 | 427 | 33 | 2 |
| 5 | 1794 | 498 | 28 | 3 |
| 6 | 1794 | 323 | 16 | 1 |
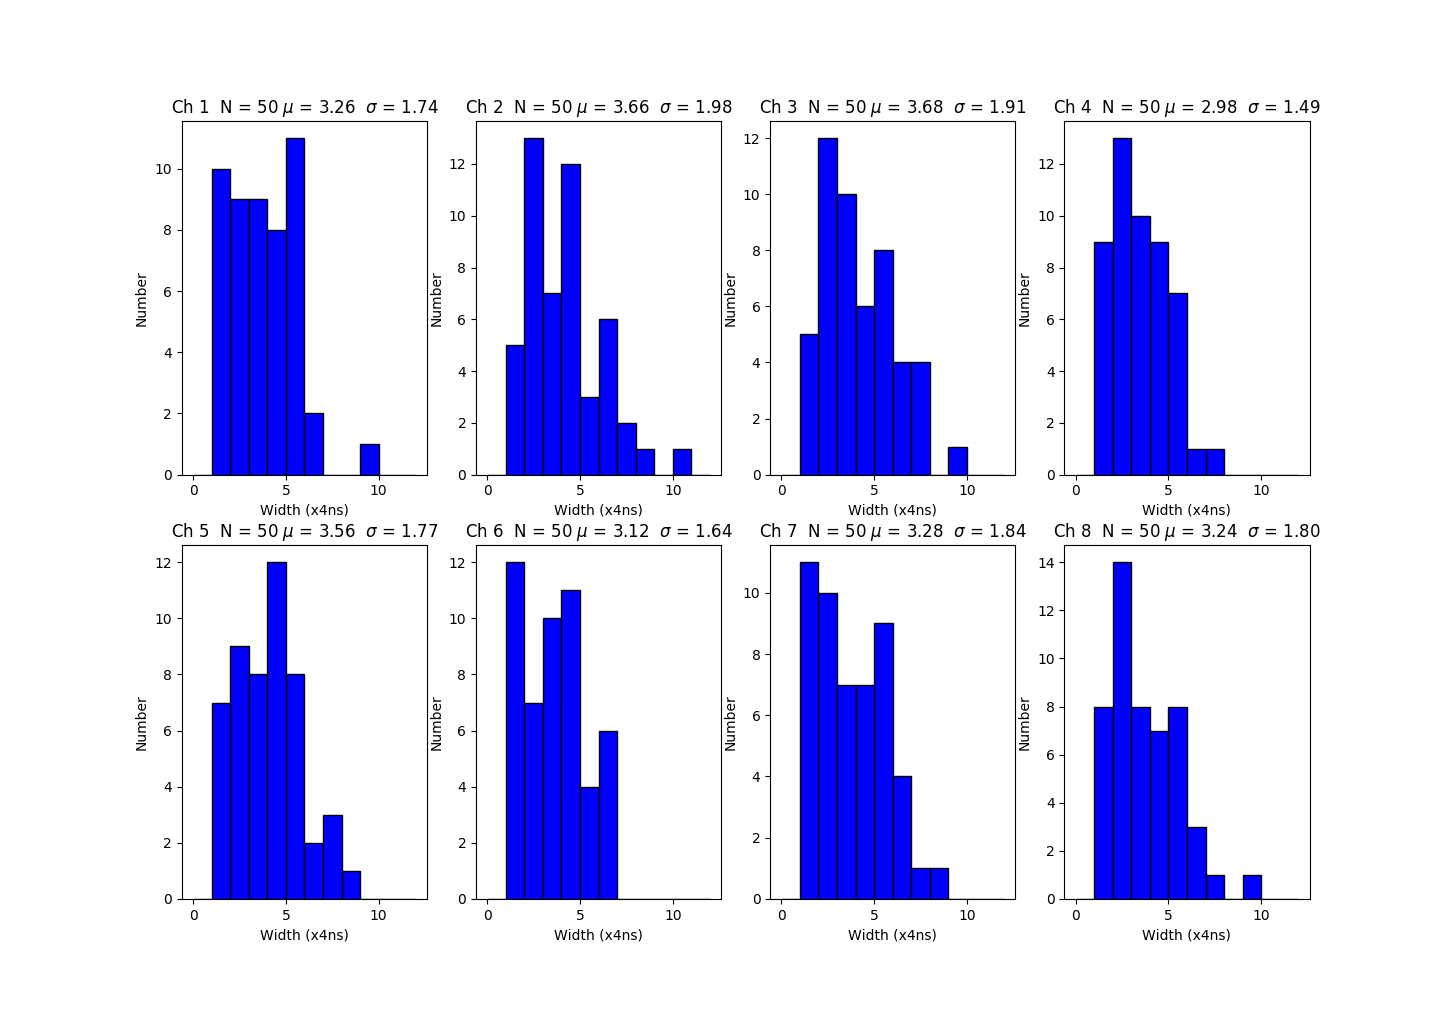
Time to make some pulse width scans. Here's what I find for the 8 channels of bank 1:
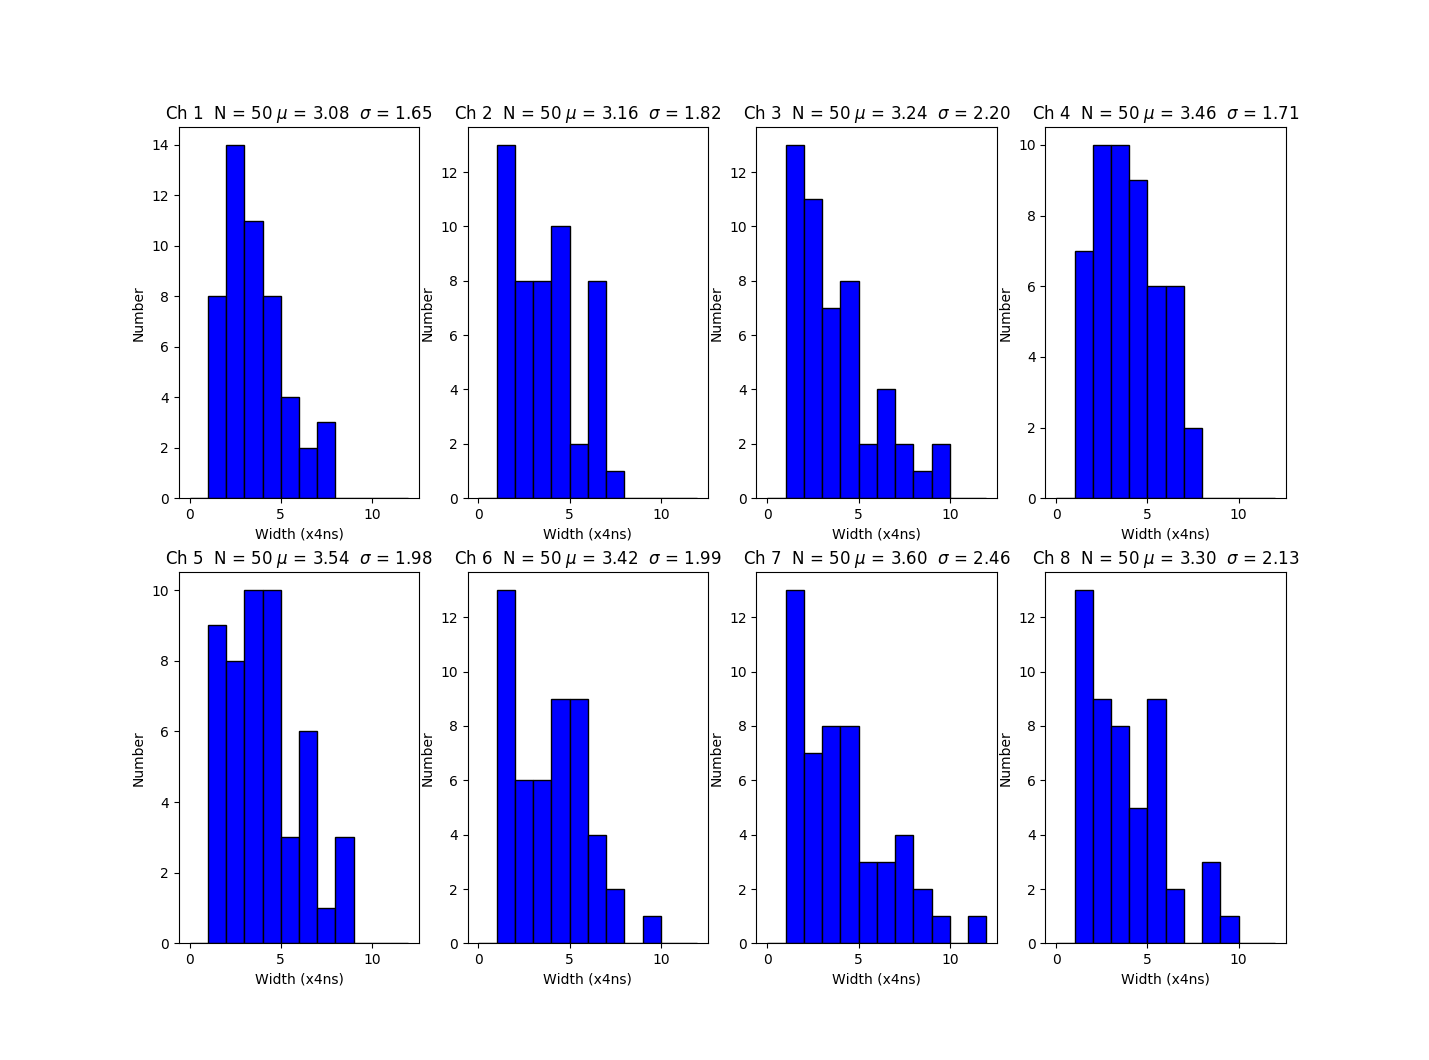
Read 1325 events
  Bank1 tubes 1-8: [27, 92, 27, 56, 44, 70, 80, 88]
  Bank2 tubes 1-8: [96, 63, 19, 23, 68, 67, 42, 69]
  Bank5 tubes 1-8: [68, 35, 62, 26, 17, 69, 82, 36]
  Bank6 tubes 1-8: [21, 32, 17, 17, 14, 36, 88, 40]
| Bank | Events | 1 | 2 | >2 |
|---|---|---|---|---|
| 1 | 1325 | 436 | 22 | 1 |
| 2 | 1325 | 405 | 21 | 0 |
| 5 | 1325 | 354 | 19 | 1 |
| 6 | 1325 | 229 | 18 | 0 |
First check if I can work with the lights on if I have all sides except the front covered. Run at 900V, here is the multiplicity with the lights on and black cloth covering everything:
Sat Dec 28 16:06:55 2019
Delta-time = 43.06639504432678
Read 1795 events  rate = 41.67982943899686 Hz
  Bank1 tubes 1-8: [59, 99, 29, 80, 61, 96, 103, 140]
  Bank2 tubes 1-8: [137, 72, 28, 23, 104, 117, 53, 69]
  Bank5 tubes 1-8: [98, 42, 84, 42, 34, 73, 117, 52]
  Bank6 tubes 1-8: [15, 59, 21, 27, 14, 45, 106, 60]
Bank1 matrix multiplicity: [1162, 600, 32, 1]
Bank2 matrix multiplicity: [1221, 545, 29, 0]
Bank5 matrix multiplicity: [1288, 474, 31, 2]
Bank6 matrix multiplicity: [1465, 313, 17, 0]
Bank1 rate: 1.37+-0.03  2.30+-0.04  0.67+-0.02  1.86+-0.03  1.42+-0.03  2.23+-0.03  2.39+-0.04  3.25+-0.04
Bank2 rate: 3.18+-0.04  1.67+-0.03  0.65+-0.02  0.53+-0.02  2.41+-0.04  2.72+-0.04  1.23+-0.03  1.60+-0.03
Bank5 rate: 2.28+-0.04  0.98+-0.02  1.95+-0.03  0.98+-0.02  0.79+-0.02  1.70+-0.03  2.72+-0.04  1.21+-0.03
Bank6 rate: 0.35+-0.01  1.37+-0.03  0.49+-0.02  0.63+-0.02  0.33+-0.01  1.04+-0.02  2.46+-0.04  1.39+-0.03
Here is the same with the lights off:
Sat Dec 28 16:09:46 2019

Delta-time = 40.718929052352905
Read 1799 events  rate = 44.1809262146114 Hz
  Bank1 tubes 1-8: [73, 109, 27, 86, 63, 92, 97, 122]
  Bank2 tubes 1-8: [126, 66, 21, 23, 94, 106, 63, 69]
  Bank5 tubes 1-8: [115, 55, 97, 38, 33, 79, 114, 43]
  Bank6 tubes 1-8: [20, 59, 16, 20, 18, 48, 144, 69]
Bank1 matrix multiplicity: [1167, 599, 30, 3]
Bank2 matrix multiplicity: [1264, 504, 29, 2]
Bank5 matrix multiplicity: [1258, 508, 33, 0]
Bank6 matrix multiplicity: [1418, 368, 13, 0]
Bank1 rate: 1.79+-0.03  2.68+-0.04 *0.66+-0.02 *2.11+-0.04  1.55+-0.03  2.26+-0.04 *2.38+-0.04 *3.00+-0.04
Bank2 rate: 3.09+-0.04  1.62+-0.03  0.52+-0.02  0.56+-0.02  2.31+-0.04  2.60+-0.04  1.55+-0.03  1.69+-0.03
Bank5 rate: 2.82+-0.04  1.35+-0.03  2.38+-0.04  0.93+-0.02  0.81+-0.02  1.94+-0.03  2.80+-0.04  1.06+-0.03
Bank6 rate: 0.49+-0.02  1.45+-0.03  0.39+-0.02  0.49+-0.02  0.44+-0.02  1.18+-0.03  3.54+-0.05  1.69+-0.03
This is weird - more rate when the lights are off? I suspect that I am running these tubes way too high a voltage. Time to look at signals. The PMT boards have test points for both PMT signals.... On bank1, the UPPER top plane, it looks like tube 3 and 4 (cable B) have very differnet gains (0.66 and 2.11 Hz on the previous run at 1609). That board is not so easy to get to so first let's switch the tubes for cable B and D (3,4 switched with 7,8) and see if it's the gain....
Sat Dec 28 17:42:46 2019

Event mismatch at i=470
Event mismatch at i=471
Delta-time = 45.27643895149231
Read 1966 events  rate = 43.42214285240736 Hz
  Bank1 tubes 1-8: [66, 100, 112, 132, 79, 120, 41, 80]
  Bank2 tubes 1-8: [124, 79, 39, 22, 94, 109, 75, 94]
  Bank5 tubes 1-8: [137, 54, 121, 41, 34, 89, 99, 44]
  Bank6 tubes 1-8: [23, 62, 29, 33, 22, 54, 128, 53]
Bank1 matrix multiplicity: [1273, 661, 29, 3]
Bank2 matrix multiplicity: [1366, 567, 30, 3]
Bank5 matrix multiplicity: [1369, 577, 18, 2]
Bank6 matrix multiplicity: [1579, 371, 15, 1]
Bank1 rate: 1.46+-0.03  2.21+-0.03 *2.47+-0.03 *2.92+-0.04 1.74+-0.03  2.65+-0.04 *0.91+-0.02 *1.77+-0.03
Bank2 rate: 2.74+-0.04  1.74+-0.03  0.86+-0.02  0.49+-0.02 2.08+-0.03  2.41+-0.03  1.66+-0.03  2.08+-0.03
Bank5 rate: 3.03+-0.04  1.19+-0.02  2.67+-0.04  0.91+-0.02 0.75+-0.02  1.97+-0.03  2.19+-0.03  0.97+-0.02
Bank6 rate: 0.51+-0.02  1.37+-0.03  0.64+-0.02  0.73+-0.02 0.49+-0.02  1.19+-0.02  2.83+-0.04  1.17+-0.02
Look at the tubes marked with the "*". It looks like the rates follow the tube, so it's the gain of the tubes. Ideally we could equalize this by modifying resistors on the PMT card...but that's for later.
Run it again to get a handle on the variations:
Sat Dec 28 17:49:39 2019
Event mismatch at i=52
Event mismatch at i=53
Delta-time = 44.98767805099487
Read 1945 events  rate = 43.23406061978314 Hz
  Bank1 tubes 1-8: [61, 111, 110, 138, 74, 99, 43, 91]
  Bank2 tubes 1-8: [132, 84, 35, 32, 85, 112, 65, 66]
  Bank5 tubes 1-8: [119, 52, 132, 51, 31, 97, 109, 53]
  Bank6 tubes 1-8: [19, 68, 17, 26, 14, 48, 137, 62]
Bank1 matrix multiplicity: [1260, 646, 37, 2]
Bank2 matrix multiplicity: [1369, 544, 30, 2]
Bank5 matrix multiplicity: [1334, 582, 27, 2]
Bank6 matrix multiplicity: [1578, 345, 20, 2]
Bank1 rate: 1.36+-0.03  2.47+-0.03  2.45+-0.03  3.07+-0.04 1.64+-0.03  2.20+-0.03  0.96+-0.02  2.02+-0.03
Bank2 rate: 2.93+-0.04  1.87+-0.03  0.78+-0.02  0.71+-0.02 1.89+-0.03  2.49+-0.04  1.44+-0.03  1.47+-0.03
Bank5 rate: 2.65+-0.04  1.16+-0.02  2.93+-0.04  1.13+-0.02 0.69+-0.02  2.16+-0.03  2.42+-0.03  1.18+-0.02
Bank6 rate: 0.42+-0.01  1.51+-0.03  0.38+-0.01  0.58+-0.02 0.31+-0.01  1.07+-0.02  3.05+-0.04  1.38+-0.03
Ah, there are significant variations! Gotta go, but here's what I'll do tomorrow:
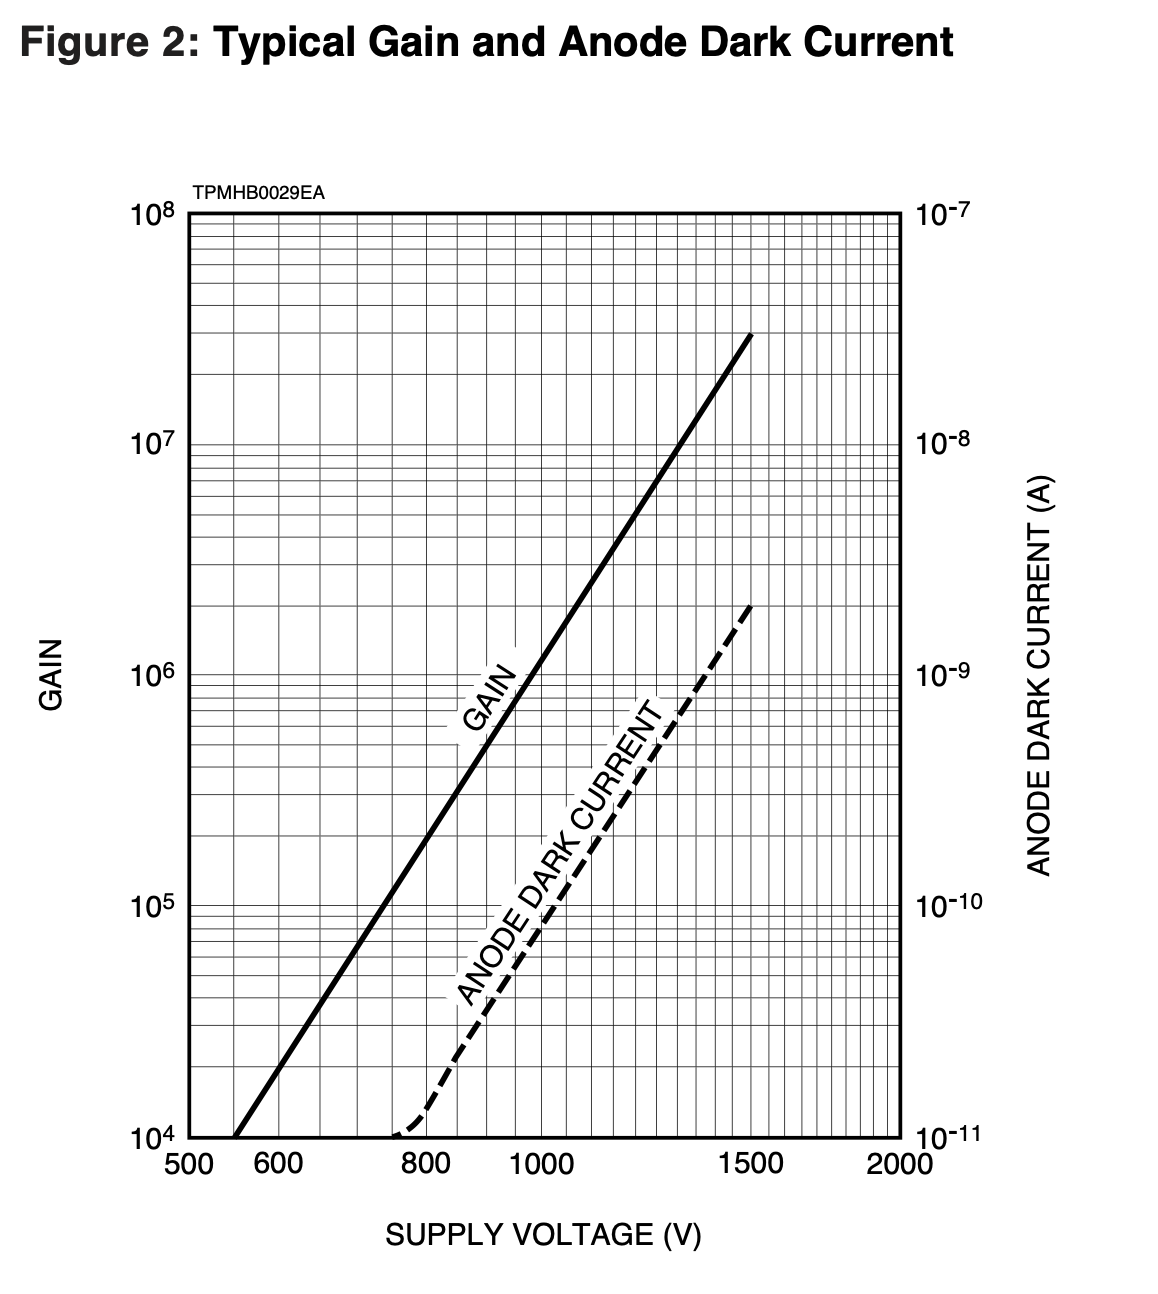
Let's look into this gain issue a bit more. I downloaded a 2 page spec sheet on the Hamamatsu R2801 tube here. If you look at the specs in the table on page 1, it says the gain is 6.7M and the dark current is 0.5nA. If you look at the figure on page 2, you wil see that those numbers corresponds to a voltage of 1250. Here is the graph blown up of gain and current vs voltage:
| V | = | IR |
| = | QR/T | |
| = | eNcGR/T | |
| = | eεNgGR/T |
V = (1.6x10⁻¹⁹)(0.001)(50,000)(500,000)(50)/20x10-9=0.01V
Something is not right here, because we've been setting the threshold to 1-3V. Time to look at signals on a scope!
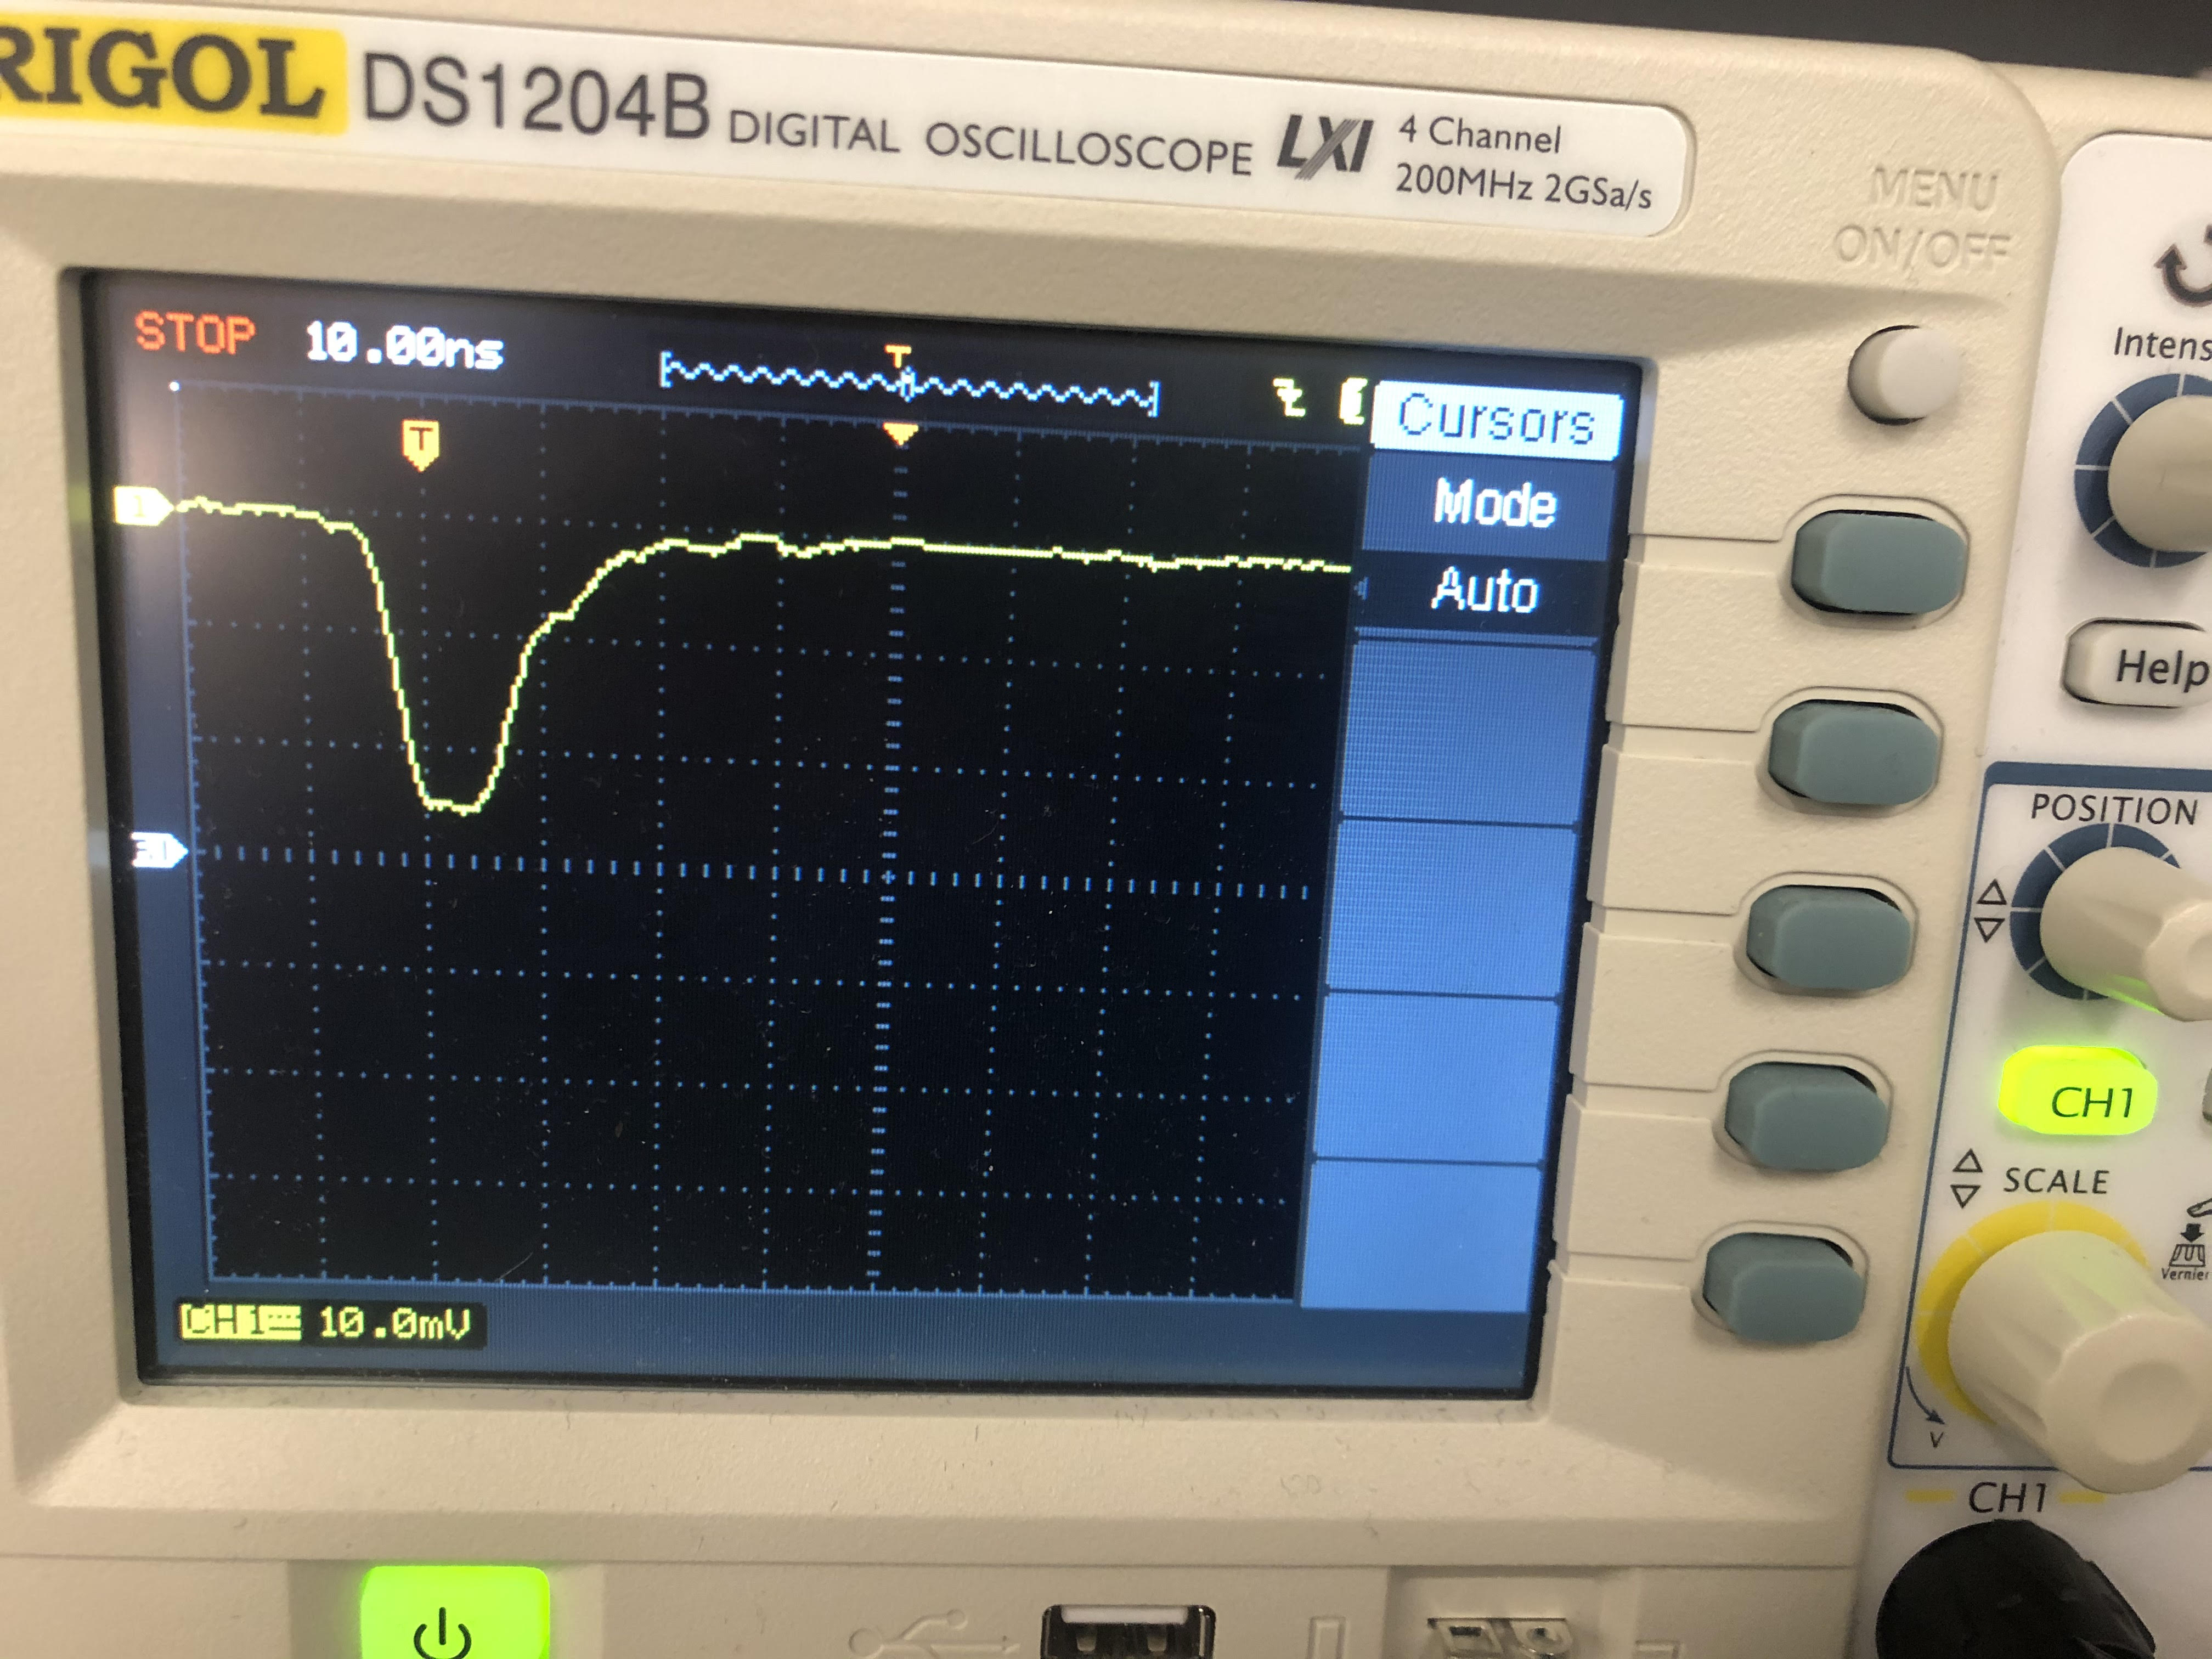
So I set the voltage to 950V and looked at signals using one of the x1 Rigol probes that have an impedance of 10MΩ. The scope input impedance is 1MΩ, so I assume that the signal I am seeing is 10x reduced to what is at the input of the differential comparitor. Ugh. In the rest of this below, I'm multiplying everything by x10 so it will compare to the actual signals.
I set the trigger threshold to -200mV. Signals come in every few seconds. The rise time is around 5ns, they rise to a peak of around -250mV, and decay away after 20ns. Here's a picture:
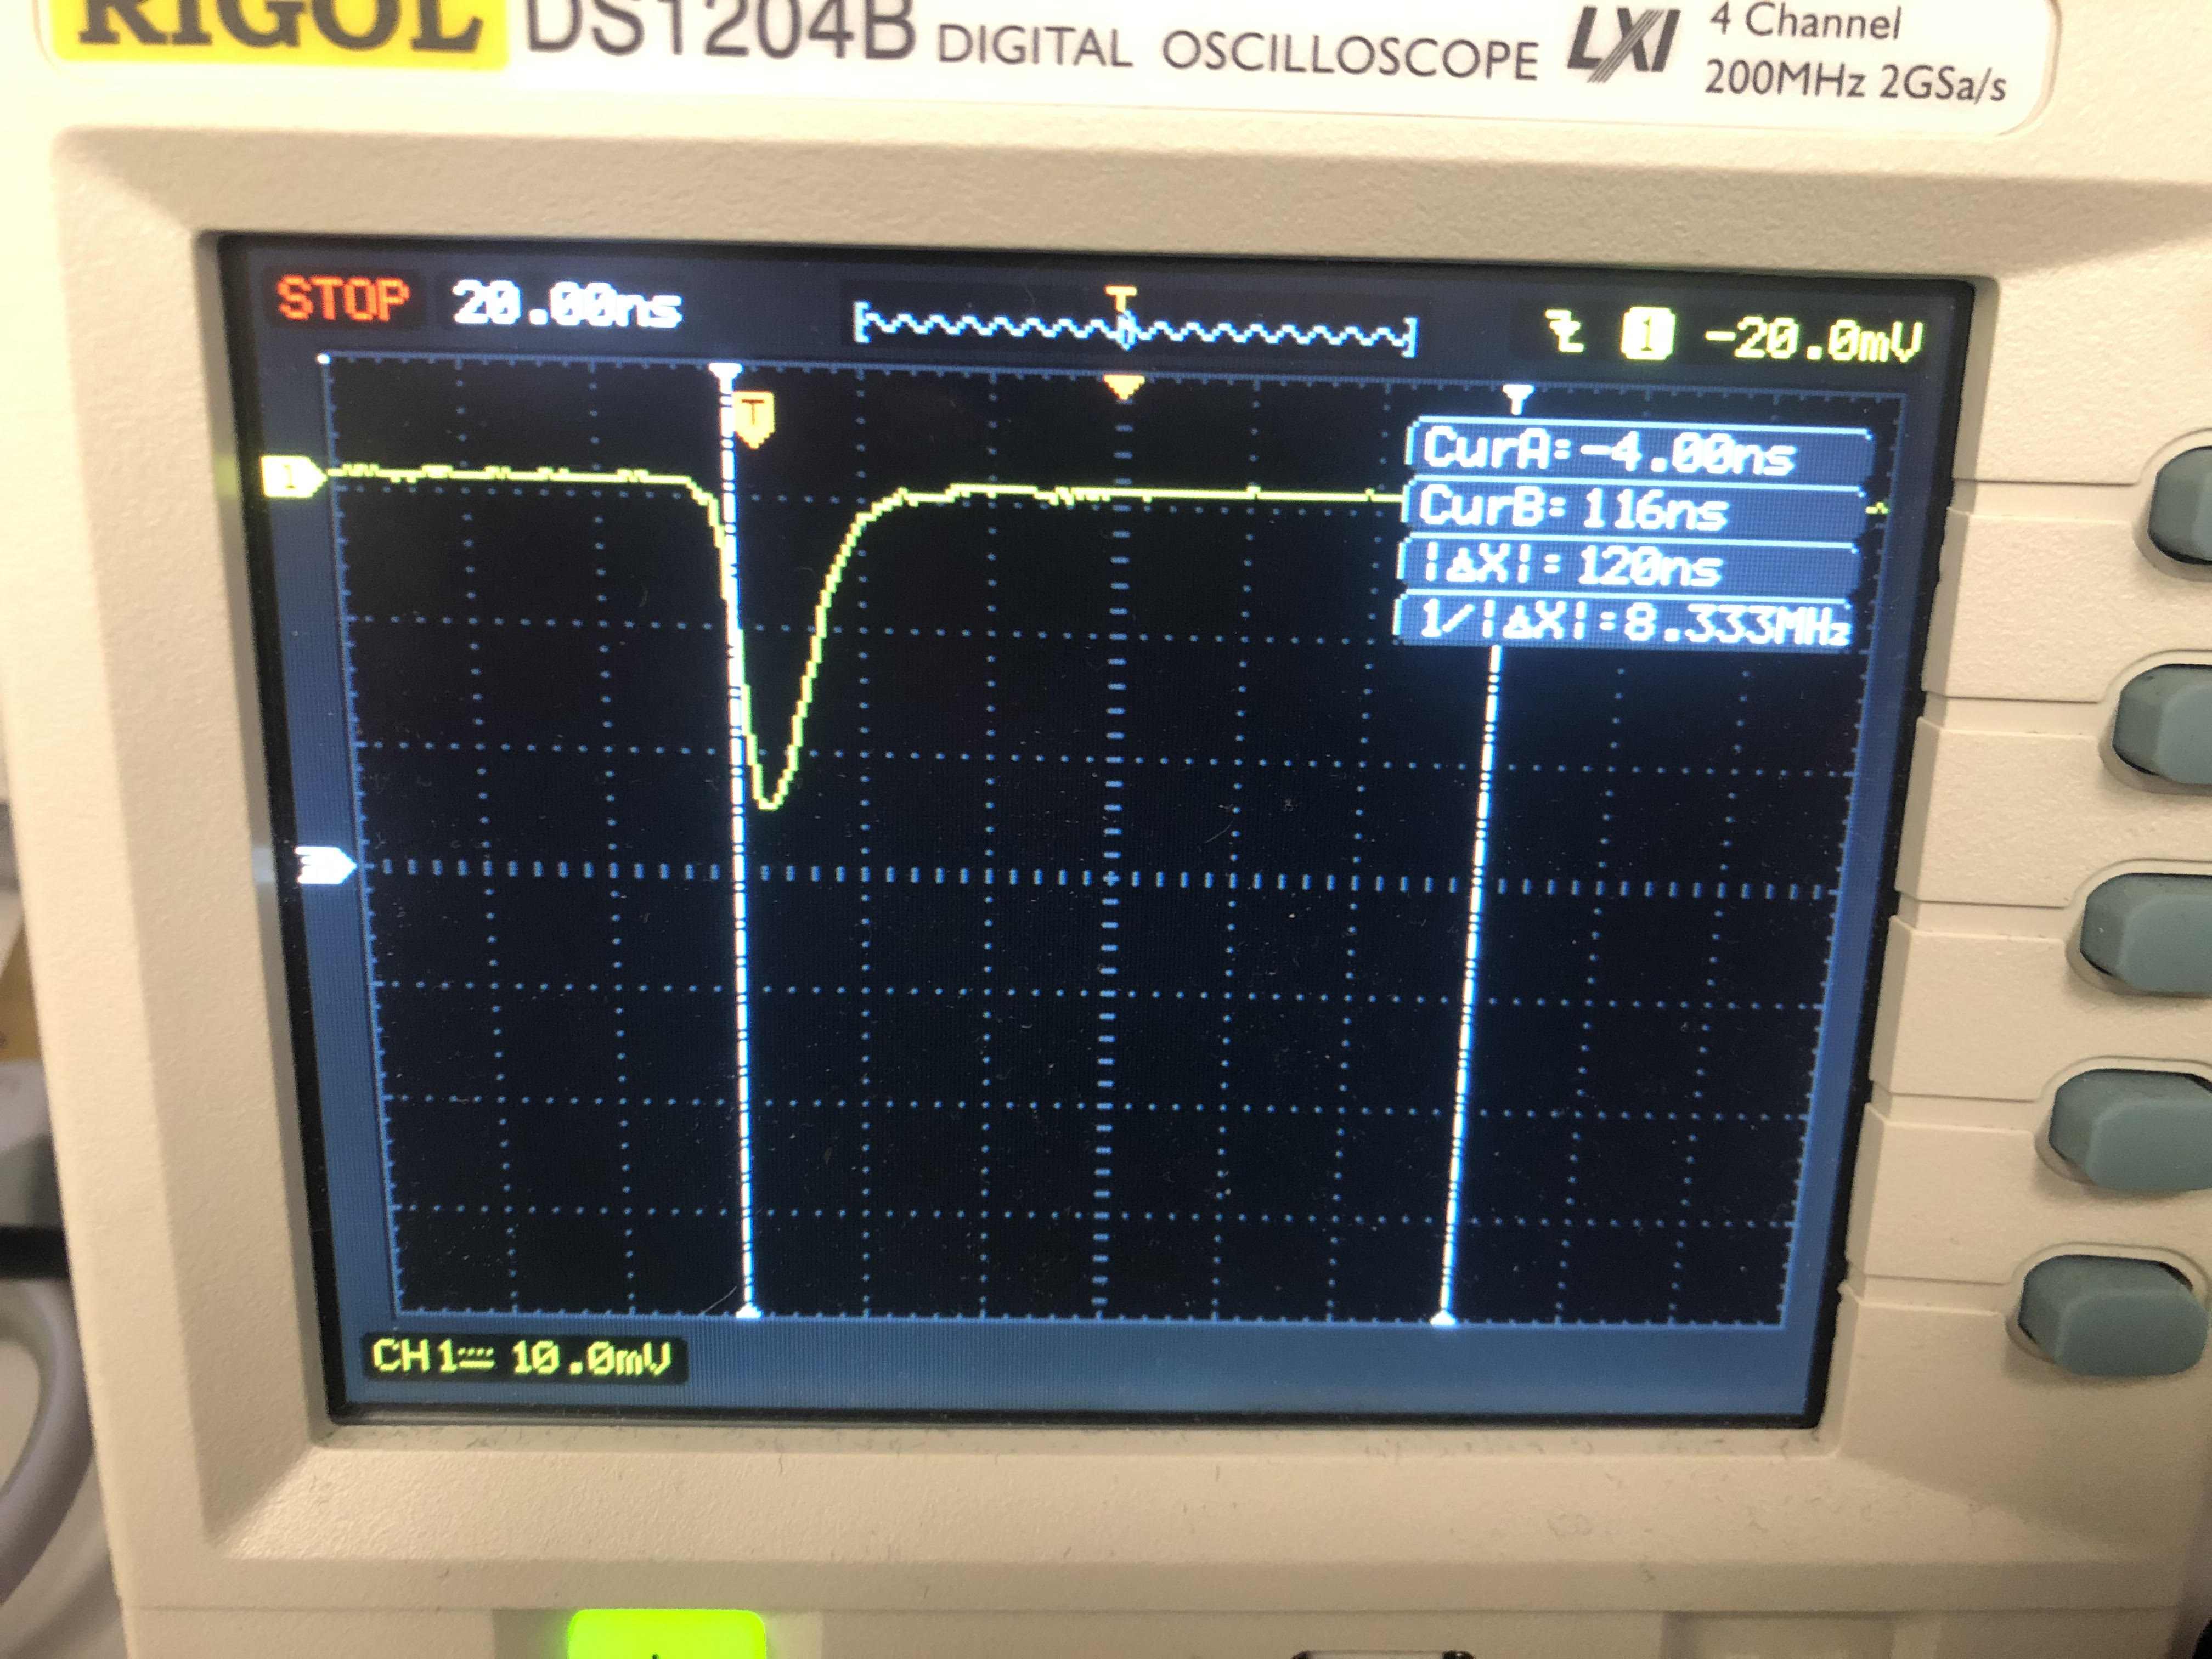
Increase voltage to 1050V. Getting nice pulses up to 500mV with widths of 20ns at around 200mV threshold. Sometimes the pulses are not so big, maybe 300mV with a width at around 10 or even less at 200mV but always more than 10 at 100mV threshold. Here is a "typical" picture:
My conclusion: I need to really lower the threshold and raise the voltage. At 1050V, the gain is around 2M, or 40times bigger than what I used in the above calculation, which gives me a voltages of 0.4V. That's a lot closer to the picture, which has a 0.2V average over the time period. I think this is where I should operate.
That's all for today...happy new year!
Ok, last day of 2019. Good riddance. But that's another story.
Continuing...here's a picture where I look at 2 tubes on the same PMT board. I trigger at 20mV on the scope (200mV in real life) and wait for an overlapping pulse, which comes pretty quickly.
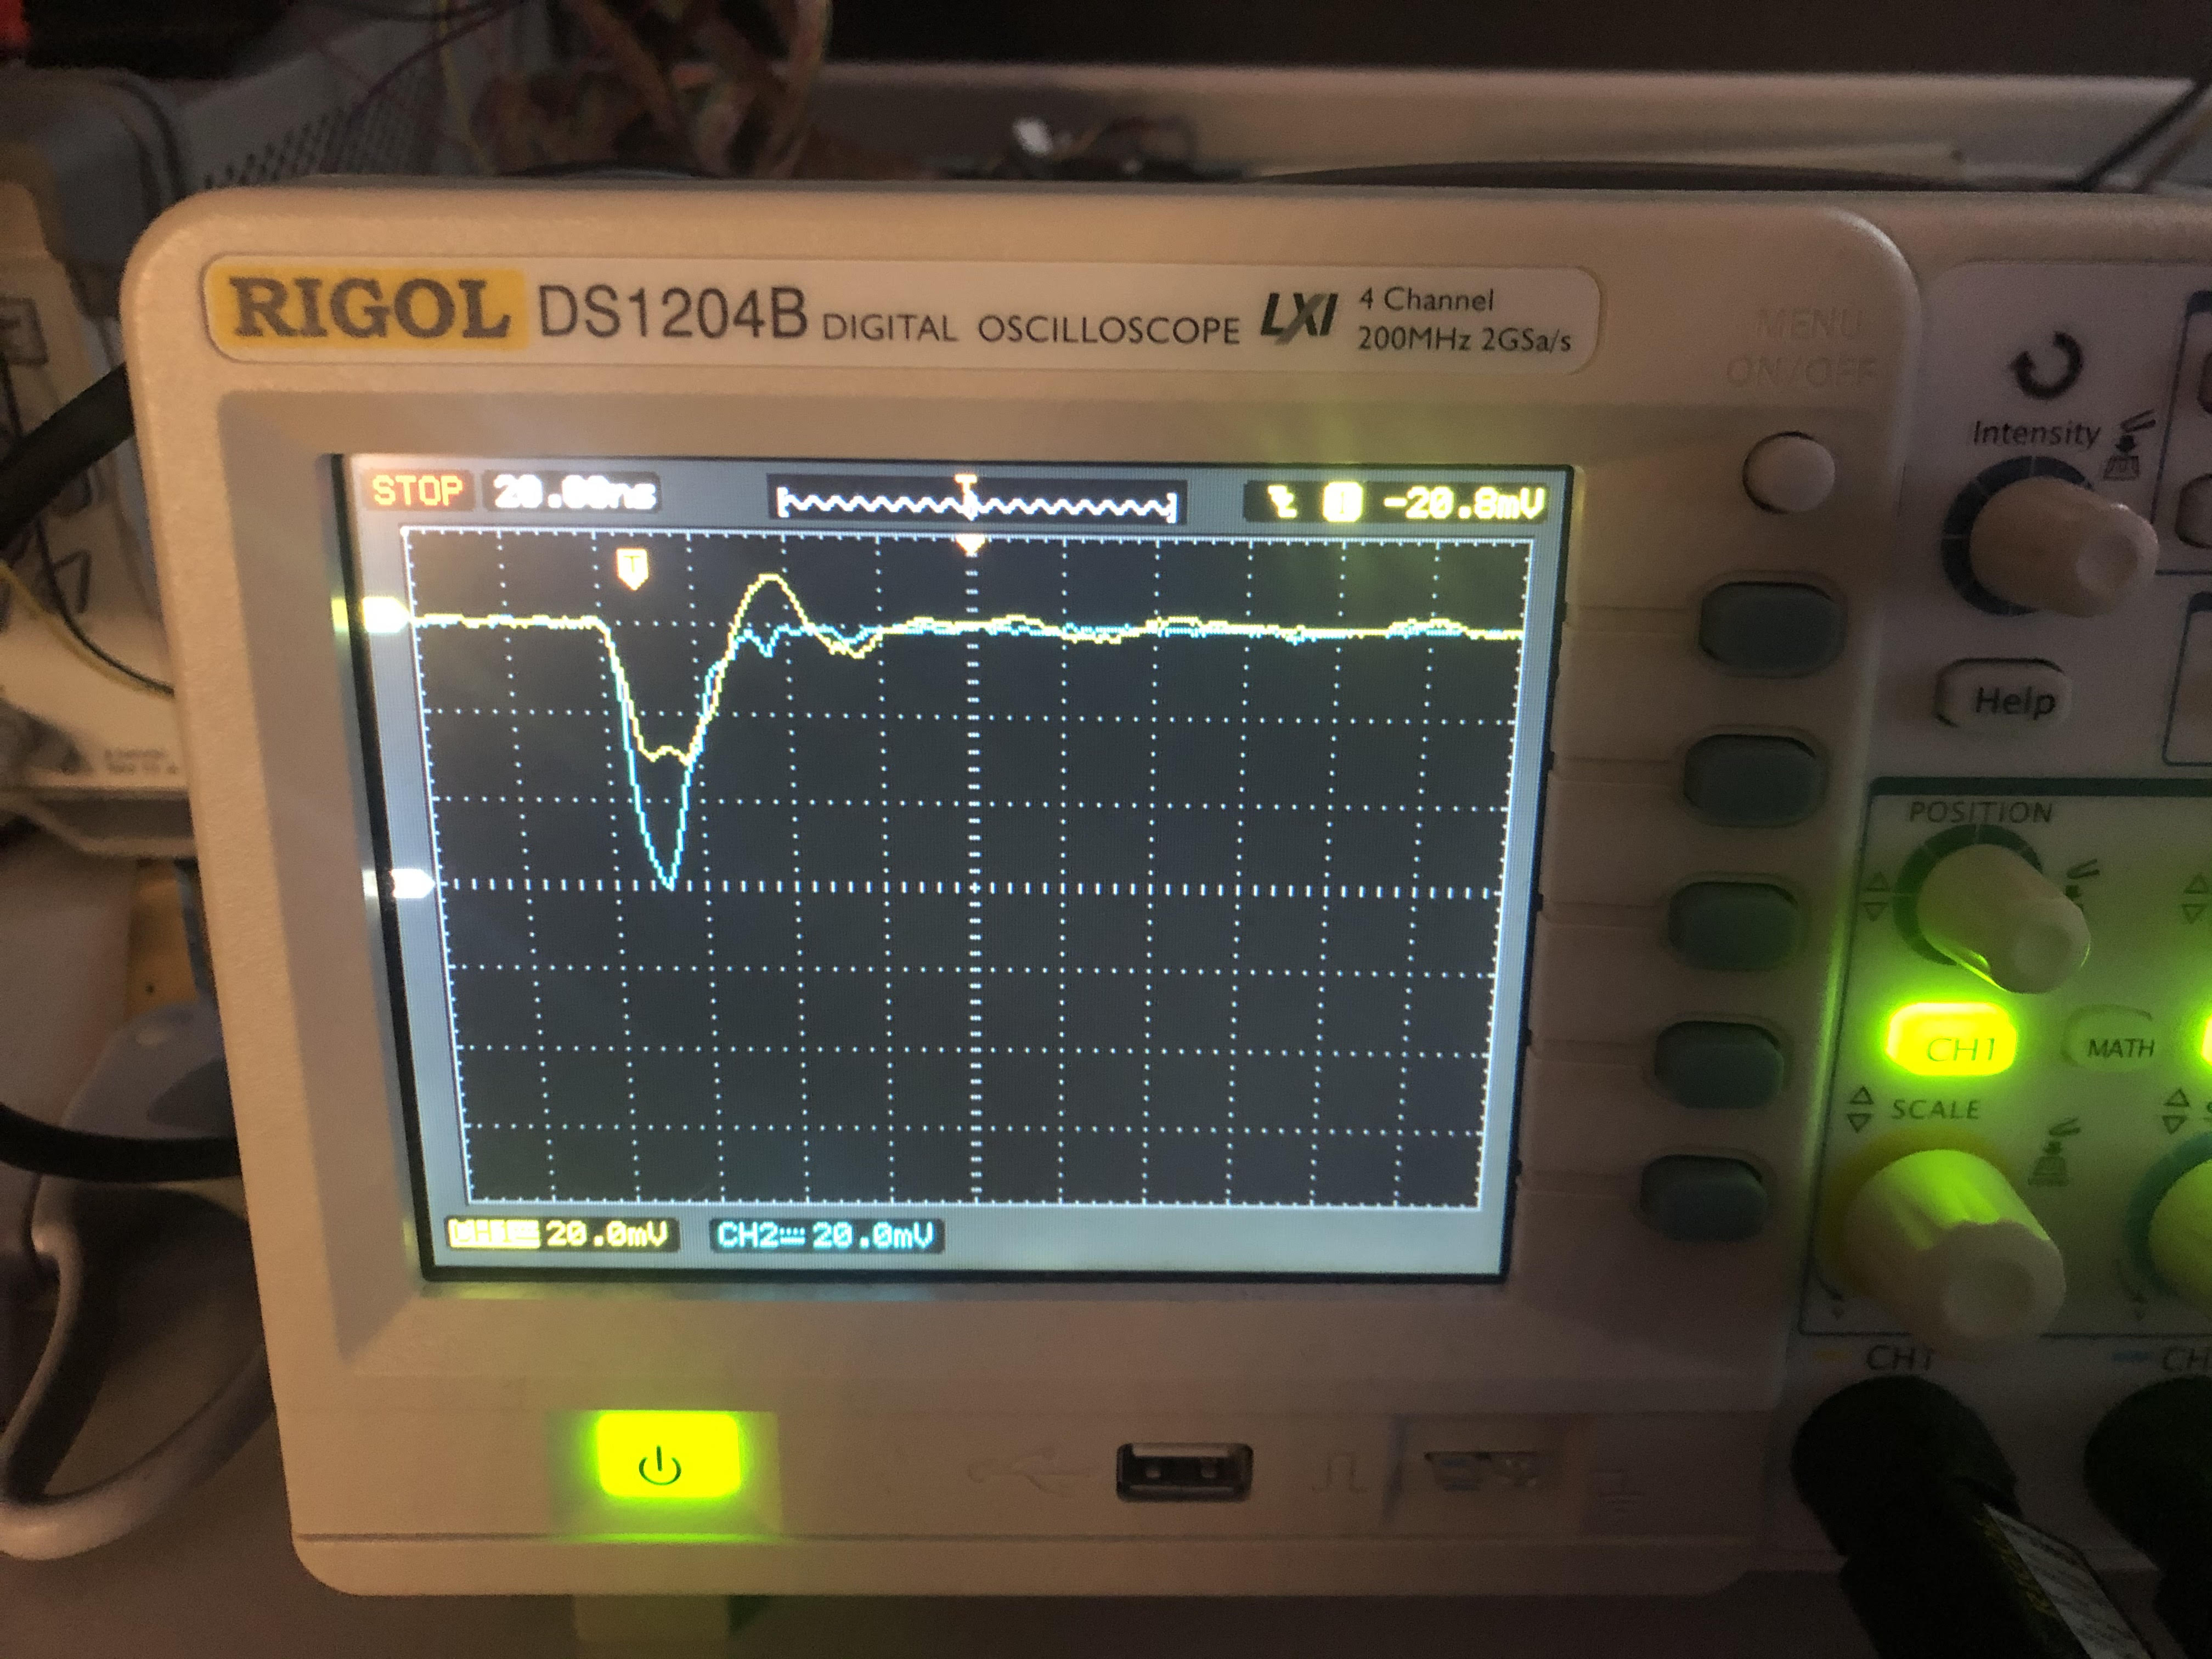
The red trace has an overshoot but that's because I only have a single ground connected (can't find the other ground wire, argh!!!). The blue pulse is at 60mV peak and the red at 30mV. Clearly the gains of those tubes are not equal.
Ok, I think I need to study the PMT board circuit better:
Ok, time to try again just for fun. Set the voltage to 1050V, the threshold to 30mV, and the trigger to 101, which for this version of the FW (0x83) means any tube on UPPER and any tube on LOWER (or1|or2)&(or5|or6). I see a high rate, but I think it's because tube 3 on LOWER top is always on. Time to take a look at that tube on the scope....I think that tube is bad, there's after pulses which indicate a degradation in the vacuum. Replacing it with another....
Multiplicities look alright, but still a bit uneven:
2019.Dec.31.1523
Tue Dec 31 15:23:12 2019
Event mismatch at i=2405
Event mismatch at i=2406
Event mismatch at i=4131
Event mismatch at i=4132
Event mismatch at i=4714
Event mismatch at i=4715
Event mismatch at i=5136
Event mismatch at i=5137
Delta-time = 14.435484886169434
Read 6132 events  rate = 424.78656230488235 Hz
  Bank1 tubes 1-8: [79, 322, 179, 268, 106, 145, 74, 348]
  Bank2 tubes 1-8: [357, 241, 115, 154, 340, 1132, 101, 160]
  Bank5 tubes 1-8: [326, 97, 78, 602, 56, 220, 398, 89]
  Bank6 tubes 1-8: [46, 110, 76, 77, 26, 53, 362, 114]
Bank1 matrix multiplicity: [4705, 1341, 79, 7]
Bank2 matrix multiplicity: [3645, 2386, 92, 9]
Bank5 matrix multiplicity: [4371, 1669, 80, 12]
Bank6 matrix multiplicity: [5326, 753, 48, 5]
Bank1 rate: 5.47+-0.16  22.31+-0.33  12.40+-0.24  18.57+-0.30  7.34+-0.19  10.04+-0.22  5.13+-0.16  24.11+-0.34
Bank2 rate: 24.73+-0.34  16.69+-0.28  7.97+-0.20  10.67+-0.23  23.55+-0.34  78.42+-0.61  7.00+-0.18  11.08+-0.23
Bank5 rate: 22.58+-0.33  6.72+-0.18  5.40+-0.16  41.70+-0.45  3.88+-0.14  15.24+-0.27  27.57+-0.36  6.17+-0.17
Bank6 rate: 3.19+-0.12  7.62+-0.19  5.26+-0.16  5.33+-0.16  1.80+-0.09  3.67+-0.13  25.08+-0.35  7.90+-0.19
Now let's try the UPPER top & LOWER bot trigger (001). Run for 44 sec, get 101 events. Overall rate is measured to be 2.3Hz, seems in the right ballpark:
2019.Dec.31.1529
Tue Dec 31 15:29:07 2019
Delta-time = 44.22638392448425
Read 101 events  rate = 2.2837046811798056 Hz
  Bank1 tubes 1-8: [10, 14, 19, 20, 19, 18, 20, 18]
  Bank2 tubes 1-8: [3, 7, 11, 19, 22, 22, 19, 15]
  Bank5 tubes 1-8: [14, 14, 21, 22, 11, 26, 19, 1]
  Bank6 tubes 1-8: [14, 10, 11, 21, 10, 11, 31, 16]
Bank1 matrix multiplicity: [0, 68, 30, 3]
Bank2 matrix multiplicity: [17, 55, 24, 5]
Bank5 matrix multiplicity: [10, 59, 29, 3]
Bank6 matrix multiplicity: [0, 79, 21, 1]
Bank1 rate: 0.23+-0.01  0.32+-0.01  0.43+-0.01  0.45+-0.02  0.43+-0.01  0.41+-0.01  0.45+-0.02  0.41+-0.01
Bank2 rate: 0.07+-0.01  0.16+-0.01  0.25+-0.01  0.43+-0.01  0.50+-0.02  0.50+-0.02  0.43+-0.01  0.34+-0.01
Bank5 rate: 0.32+-0.01  0.32+-0.01  0.47+-0.02  0.50+-0.02  0.25+-0.01  0.59+-0.02  0.43+-0.01  0.02+-0.00
Bank6 rate: 0.32+-0.01  0.23+-0.01  0.25+-0.01  0.47+-0.02  0.23+-0.01  0.25+-0.01  0.70+-0.02  0.36+-0.01
Some of the tubes seem to have an awfully low gain: Bank 2 tube 1, Bank 5 tube 8. This is not consistent with what's in the run with trigger condition (000) as in the table just above this last one.
From those 101 events, here what I see for participation of Bank 2 and Bank 5:
Let's do another run to see how things change:
2019.Dec.31.1652

Tue Dec 31 16:52:40 2019

Delta-time = 44.19937491416931
Read 96 events  rate = 2.17197641791139 Hz
  Bank1 tubes 1-8: [12, 11, 18, 21, 14, 19, 16, 16]
  Bank2 tubes 1-8: [3, 9, 8, 17, 23, 28, 20, 14]
  Bank5 tubes 1-8: [12, 10, 10, 22, 11, 29, 21, 1]
  Bank6 tubes 1-8: [5, 15, 14, 16, 4, 15, 33, 15]
Bank1 matrix multiplicity: [0, 67, 27, 2]
Bank2 matrix multiplicity: [14, 46, 32, 4]
Bank5 matrix multiplicity: [15, 49, 29, 3]
Bank6 matrix multiplicity: [0, 75, 21, 0]
Bank1 rate: 0.27+-0.01  0.25+-0.01  0.41+-0.01  0.48+-0.02  0.32+-0.01  0.43+-0.01  0.36+-0.01  0.36+-0.01
Bank2 rate: 0.07+-0.01  0.20+-0.01  0.18+-0.01  0.38+-0.01  0.52+-0.02  0.63+-0.02  0.45+-0.02  0.32+-0.01
Bank5 rate: 0.27+-0.01  0.23+-0.01  0.23+-0.01  0.50+-0.02  0.25+-0.01  0.66+-0.02  0.48+-0.02  0.02+-0.00
Bank6 rate: 0.11+-0.01  0.34+-0.01  0.32+-0.01  0.36+-0.01  0.09+-0.01  0.34+-0.01  0.75+-0.02  0.34+-0.01
Hmm....still looks like tube B21 (Bank 2, tube 1) and B58 are not participating very much. Have to think about this. Also the multiplicities are more or less consistent on many tubes but not on all of them (e.g. B61 had 0.32 before and 0.11 now). Probably I need a longer run.
Ok, modified the event display. Things are looking good! Happy New Year, I'm going home for the day.
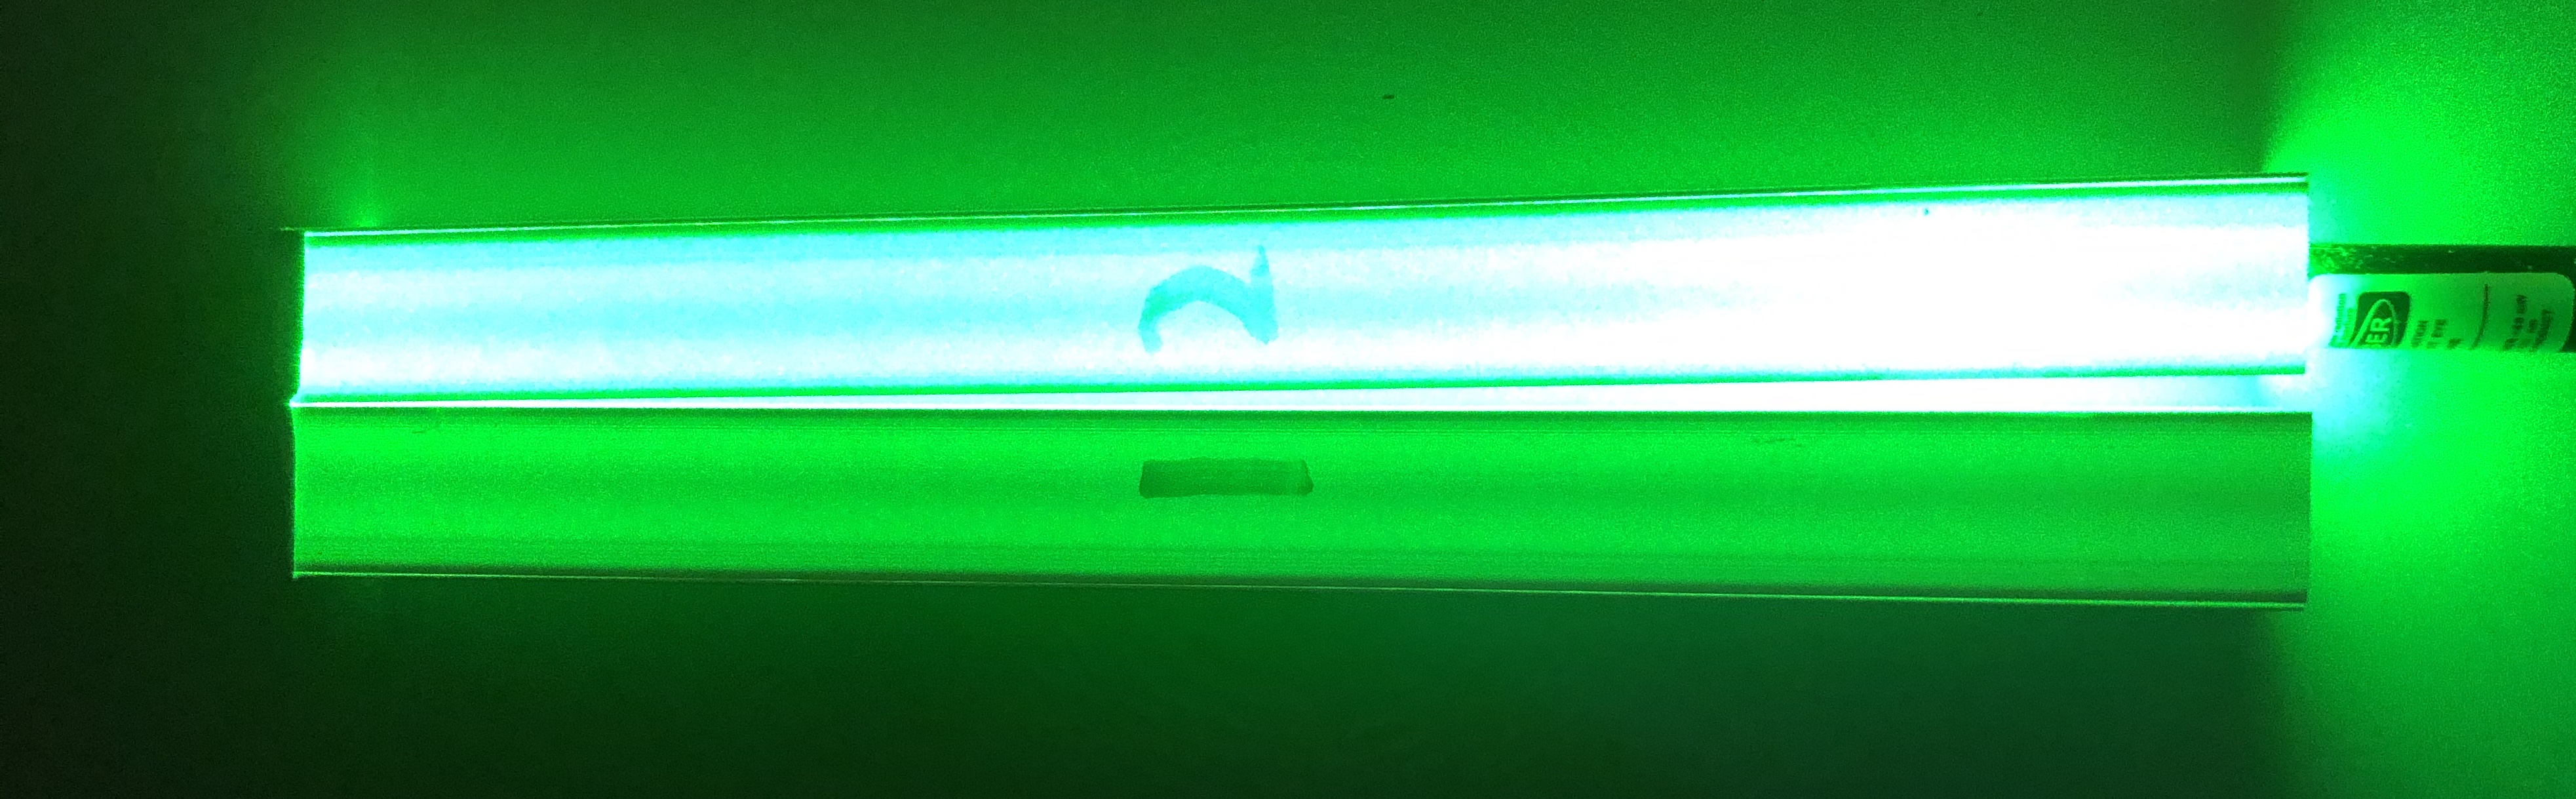
Lots of changes, the biggest of which is that we have to wrap each "tube" so that light doesn't leak from one to the next. Take a look at the following photo, which shows a green laser shooting into the center of a tube. It's easy to see that the tube next to it also shows up.
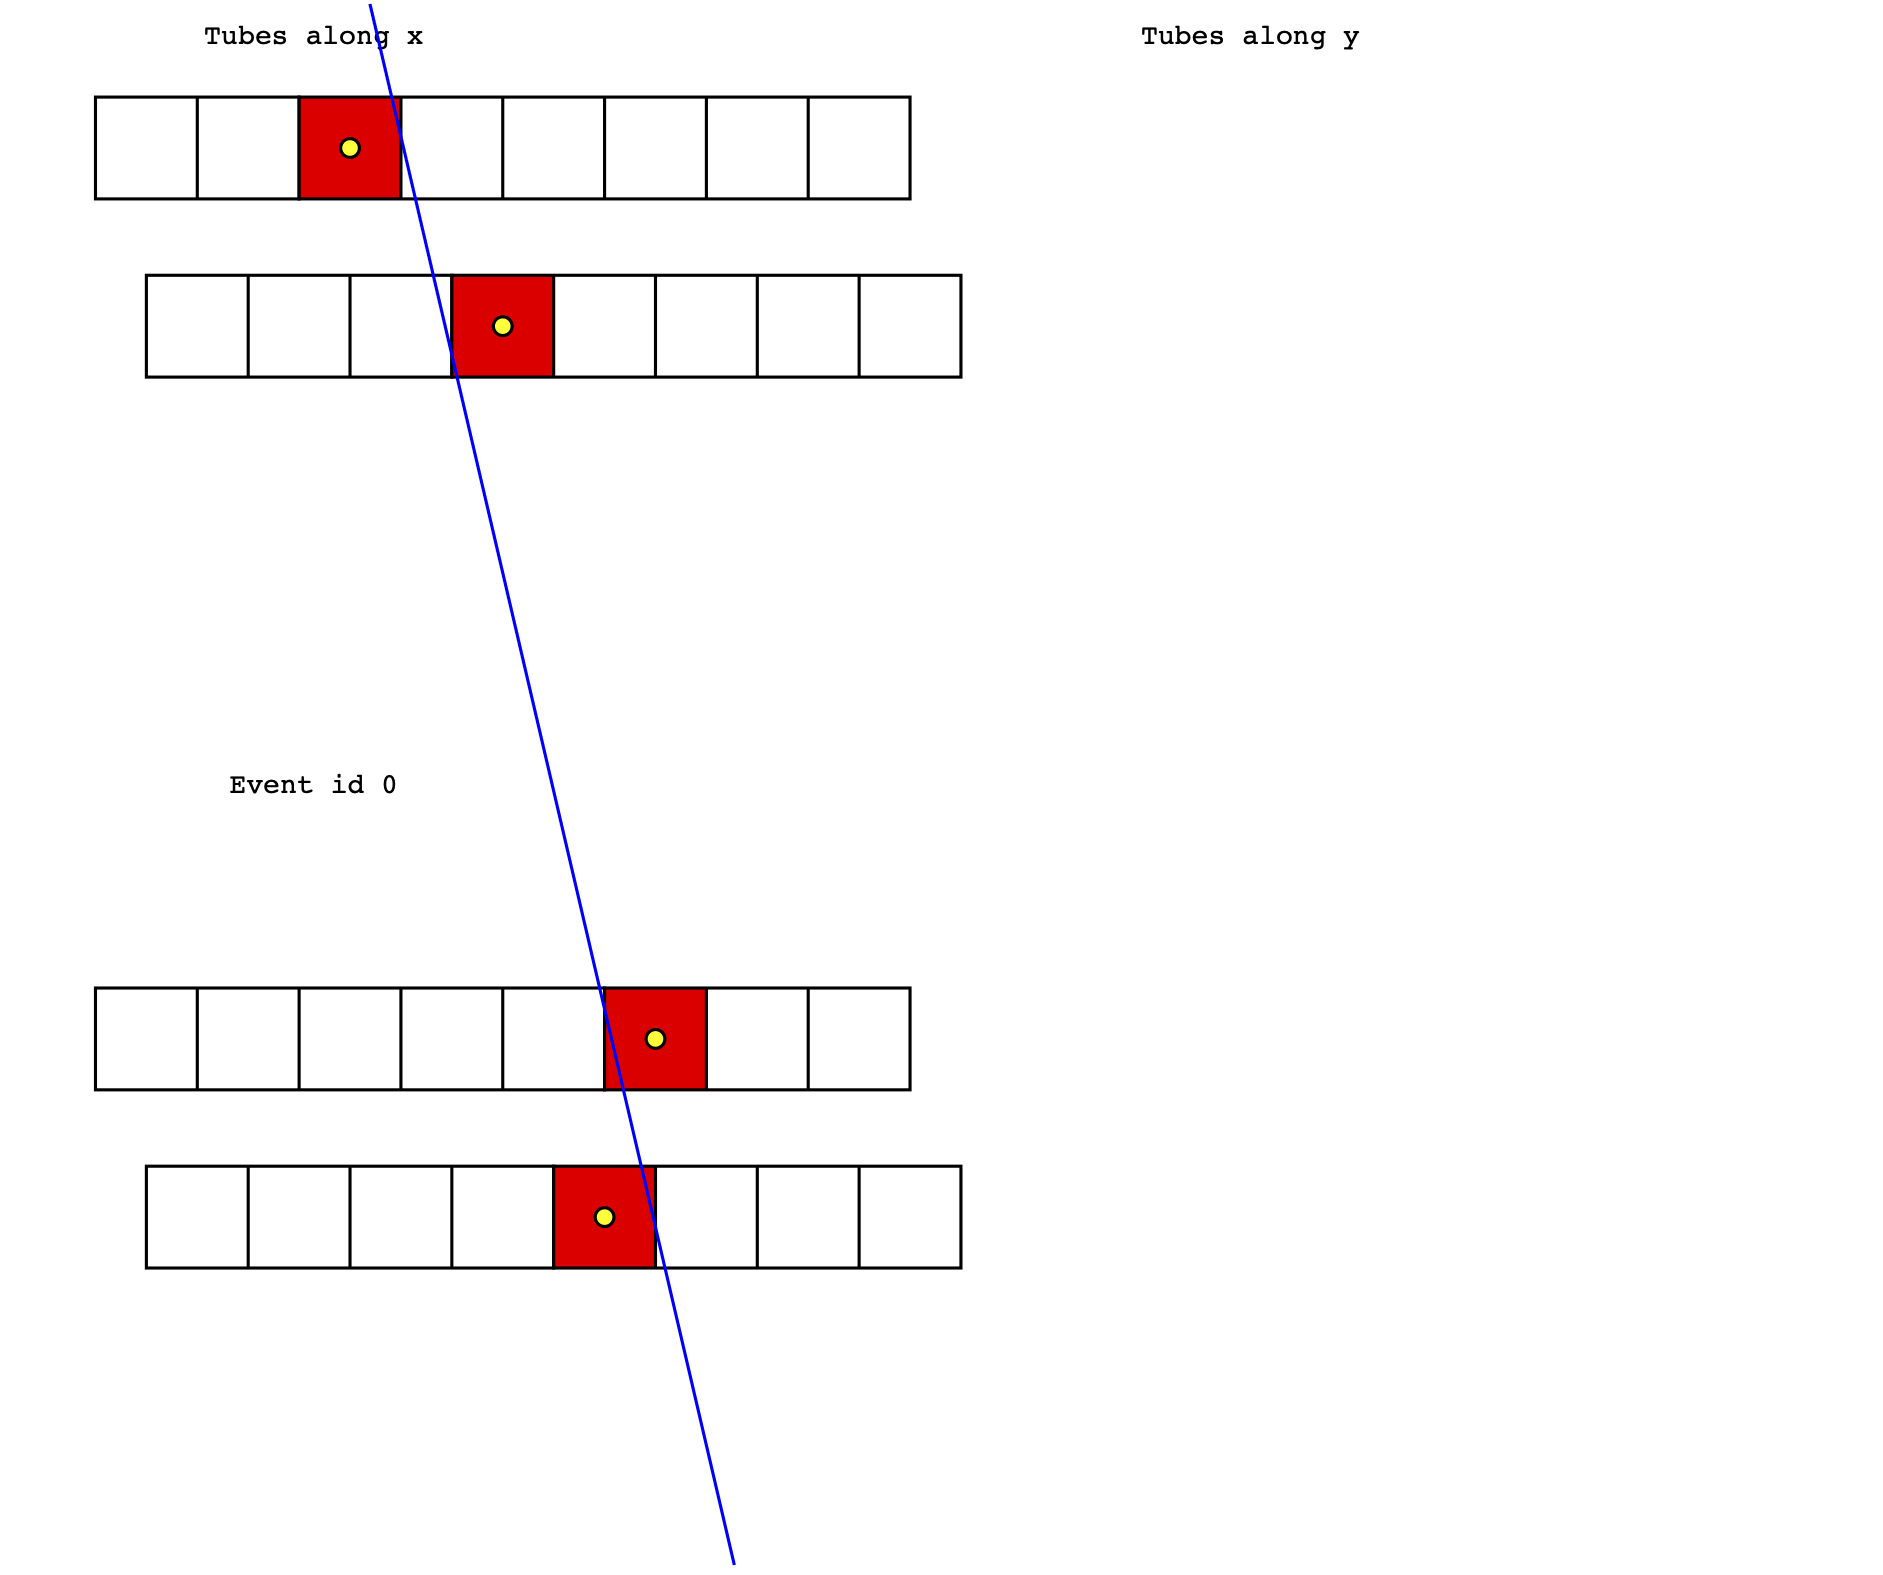
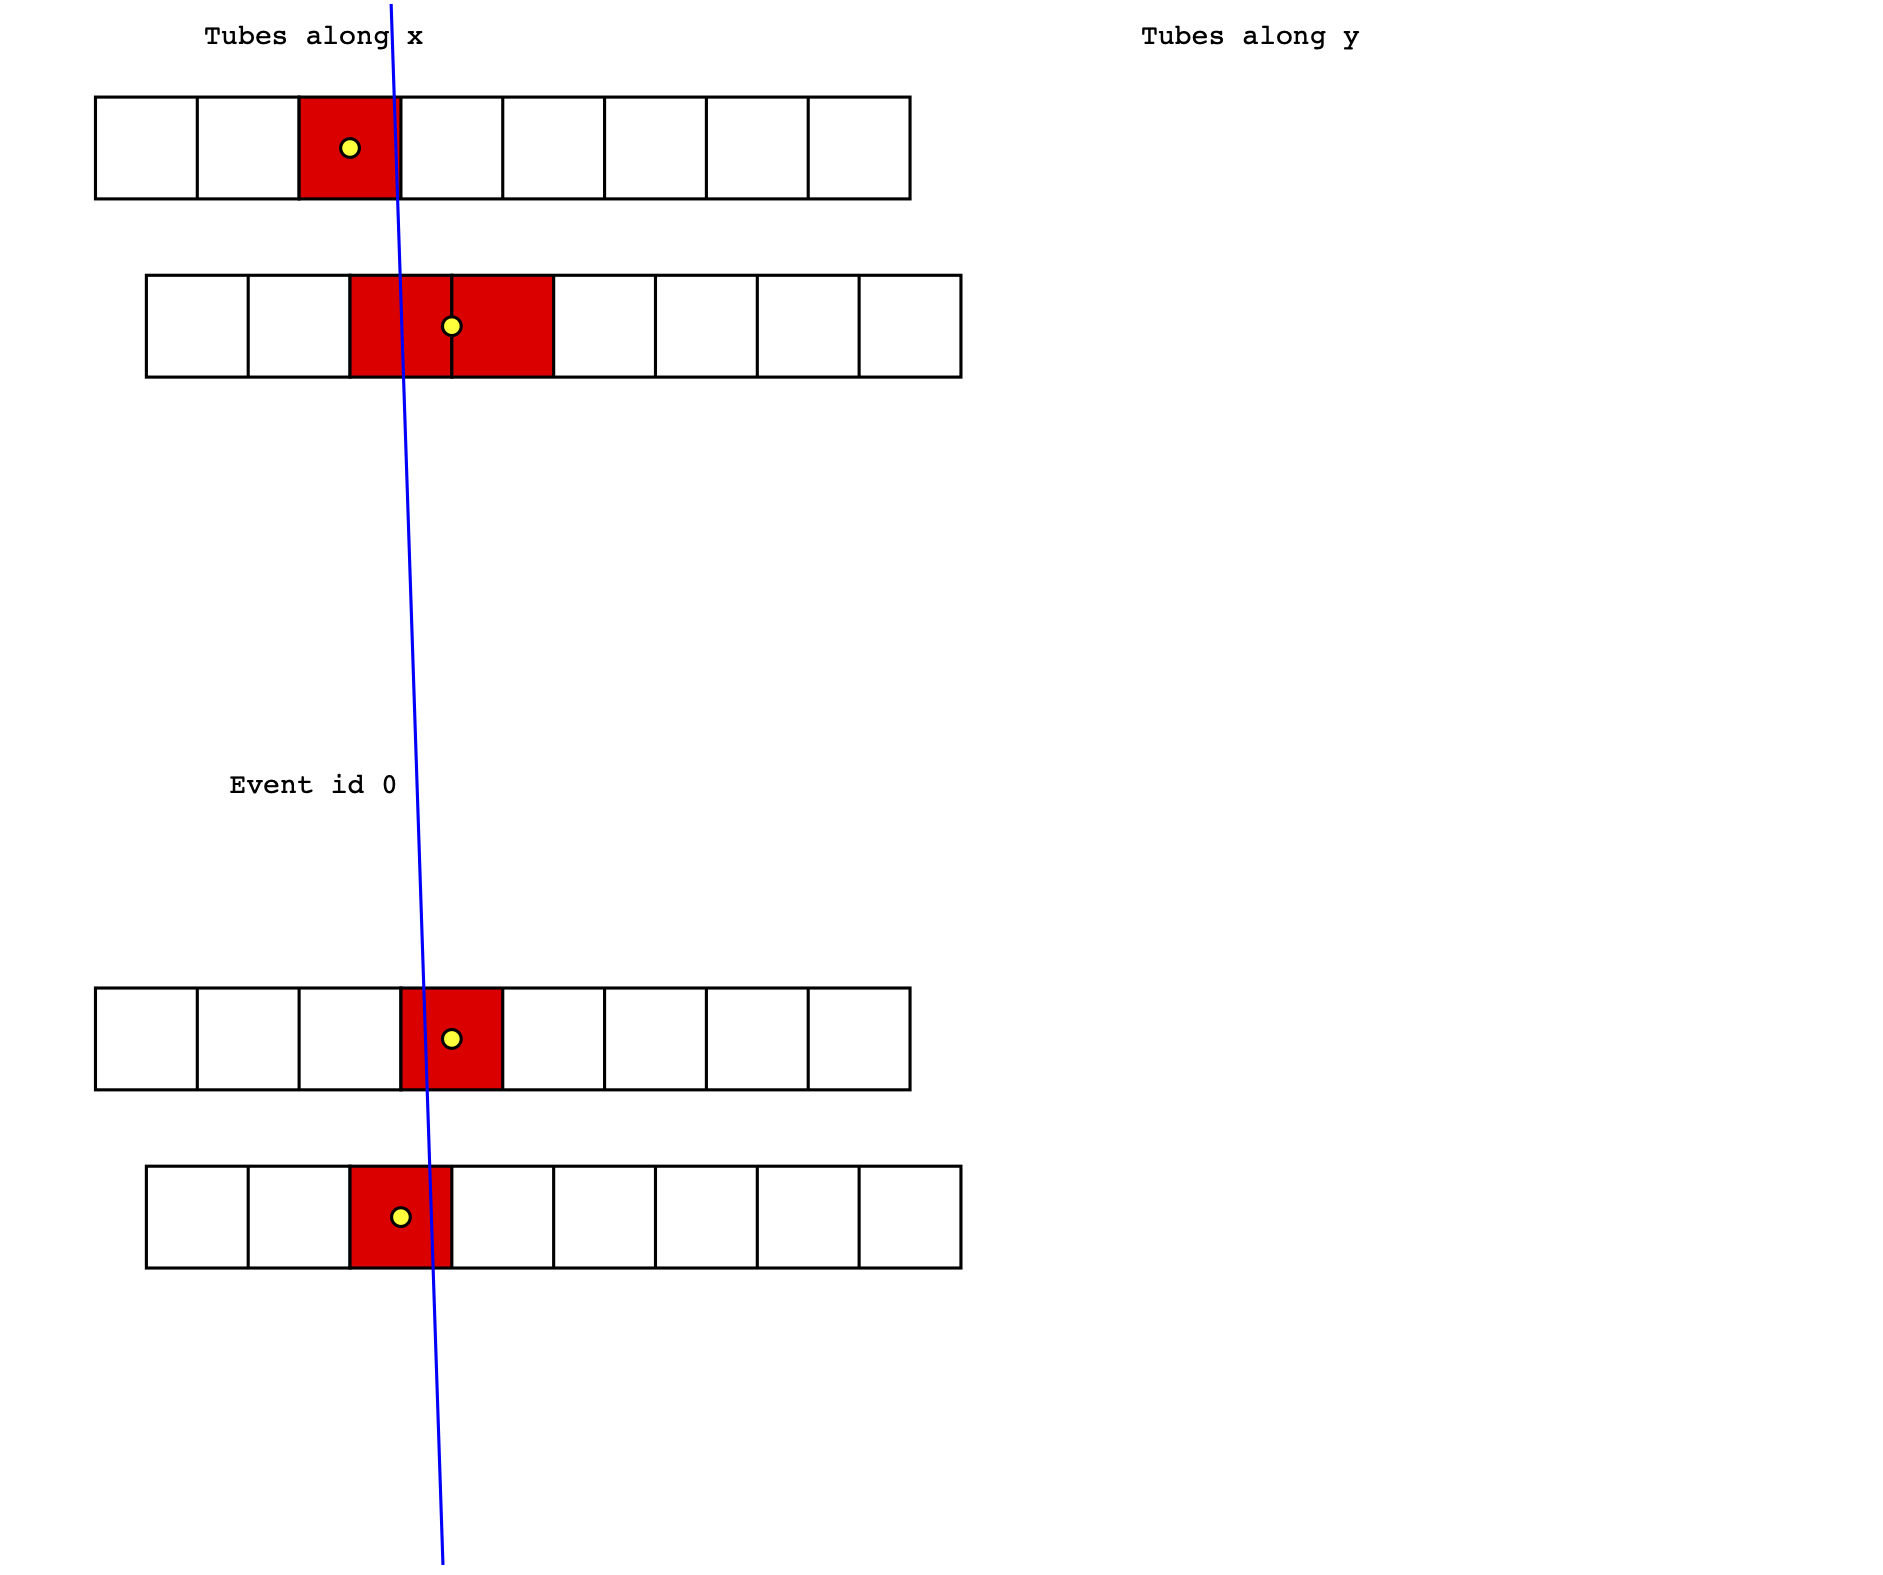
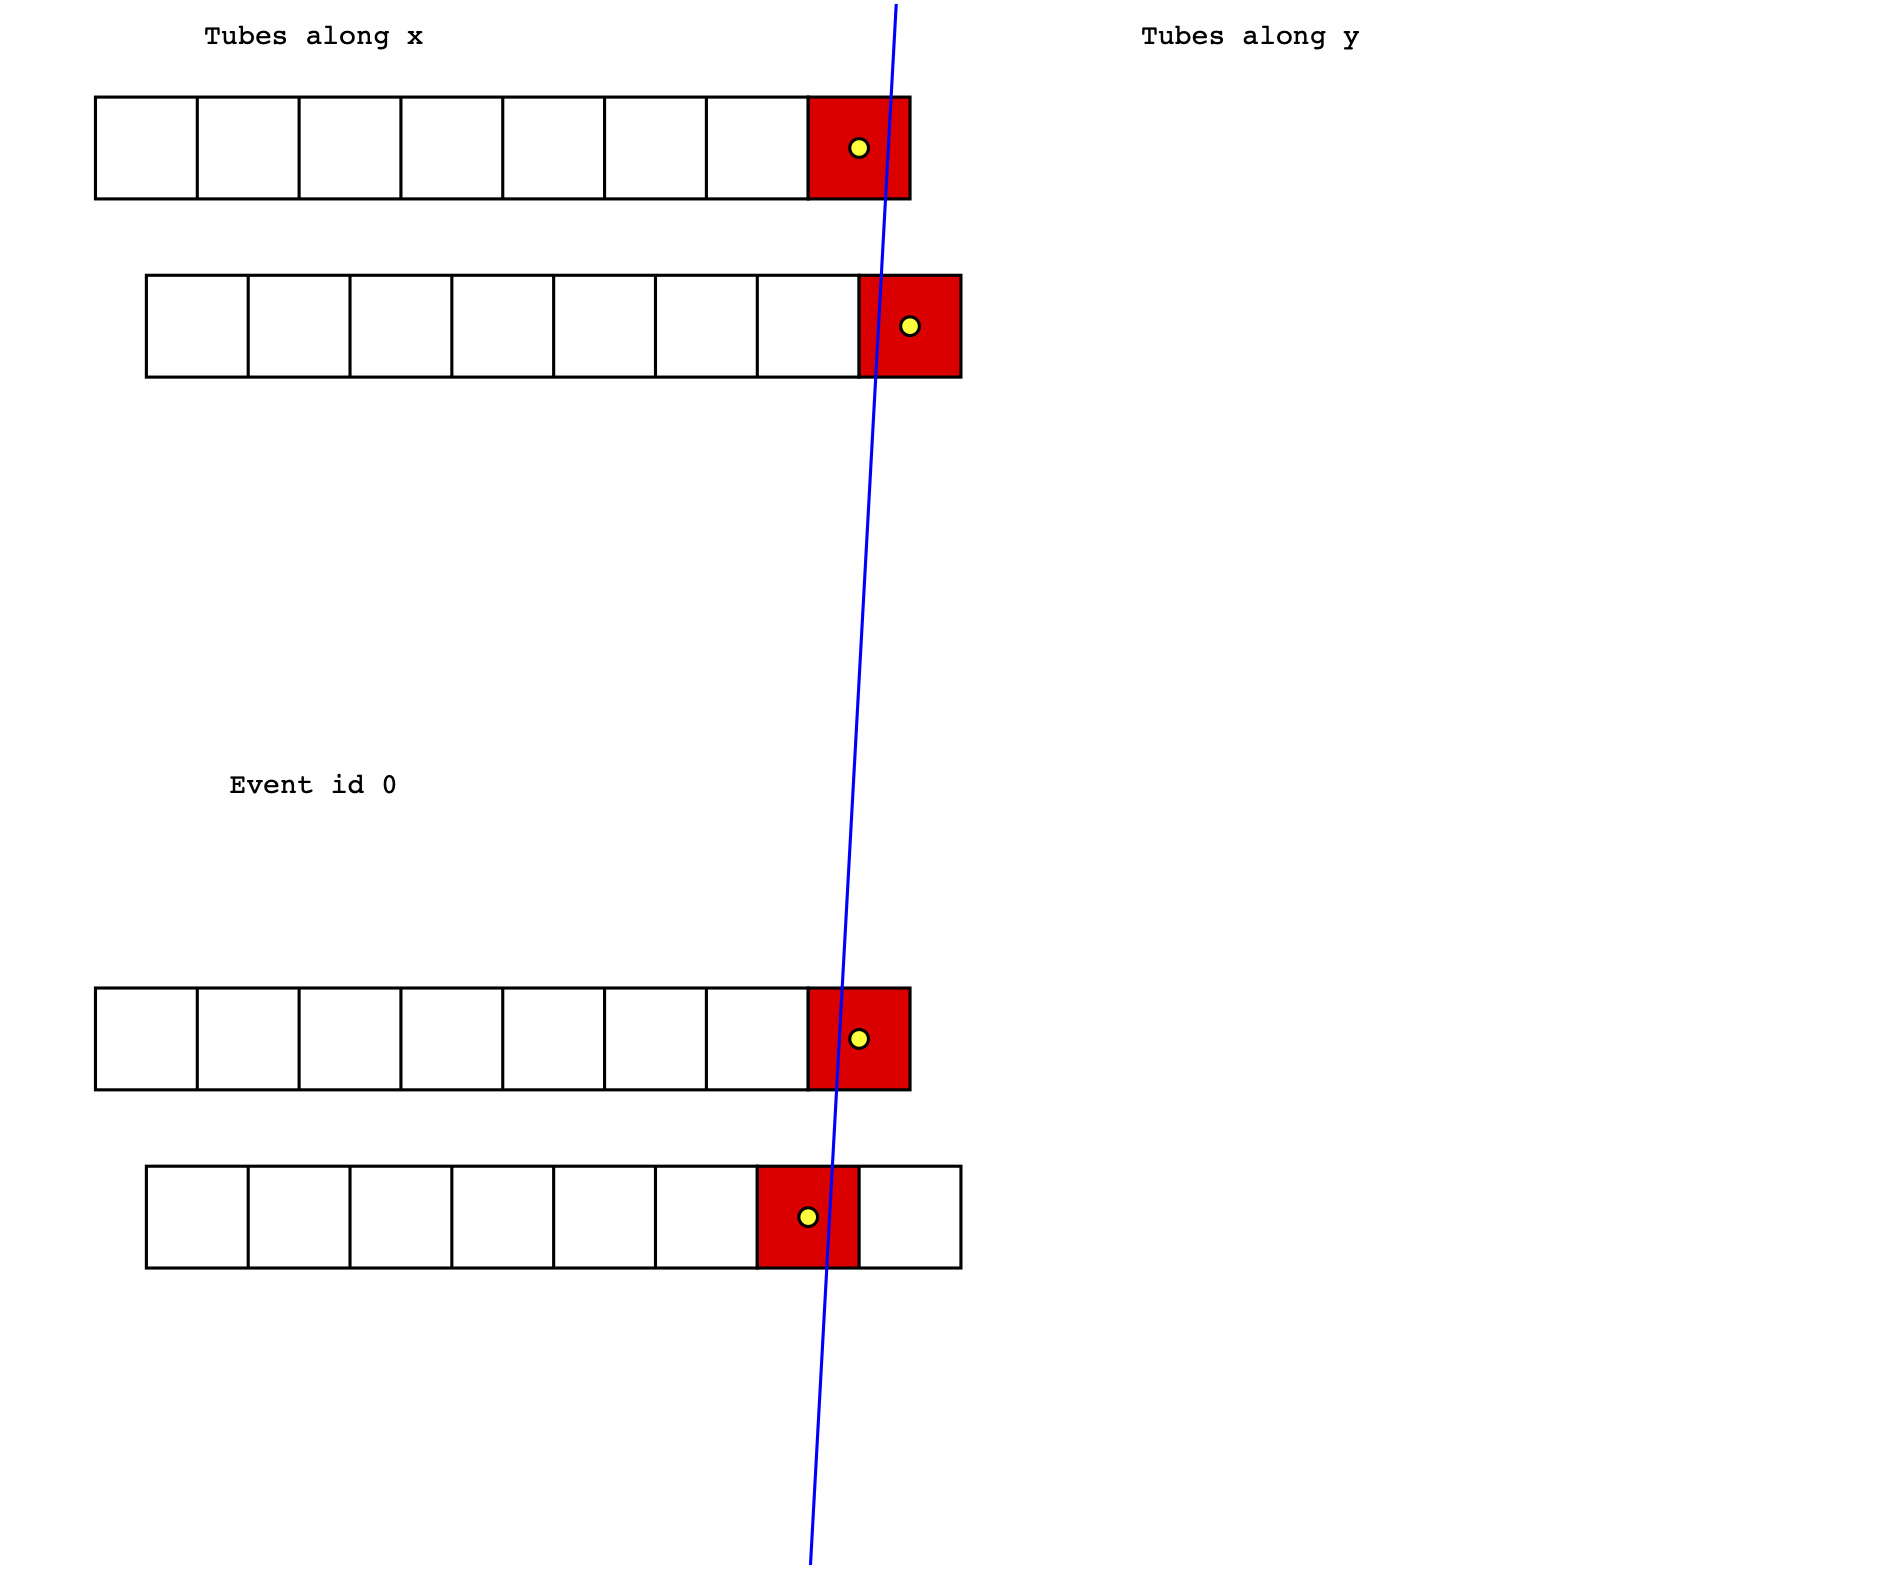
I've also changed the line fitting. Used to use least squares, which fits the y distance. This is clearly not right, as the x value of each tube coordinate also has an uncertainty, equal to the y uncertainty. So we have to use something that limits the distance of closest approach, also called "orthogonal regression". It's messy to do unless both of the uncertainties in x and y are the same, which is our case. Mathematica has a nice derivation of it here. I've coded it up in de3_v15.py and it works pretty well: Here are a few event displays:
Bank1 matrix:
[[34 10  1  0  0  1  1  0]
 [10 67  5  0  0  1  1  0]
 [ 1  5 48  8  0  1  1  1]
 [ 0  0  8 48  1  1  0  0]
 [ 0  0  0  1 37  3  0  0]
 [ 1  1  1  1  3 47  8  2]
 [ 1  1  1  0  0  8 33  7]
 [ 0  0  1  0  0  2  7 47]]
Bank2 matrix:
[[10  7  2  0  0  1  0  2]
 [ 7 38 11  1  0  1  0  3]
 [ 2 11 42 10  1  1  0  2]
 [ 0  1 10 55  6  1  0  1]
 [ 0  0  1  6 38  2  0  0]
 [ 1  1  1  1  2 48  7  2]
 [ 0  0  0  0  0  7 28  8]
 [ 2  3  2  1  0  2  8 38]]
Bank5 matrix:
[[ 9  1  0  4  3  0  0  0]
 [ 1 14  5  2  1  1  1  0]
 [ 0  5 39  4  0  2  0  0]
 [ 4  2  4 41  6  0  0  0]
 [ 3  1  0  6 39  3  3  0]
 [ 0  1  2  0  3 48 14  3]
 [ 0  1  0  0  3 14 55  4]
 [ 0  0  0  0  0  3  4 26]]
Bank6 matrix:
[[22  6  1  1  0  1  0  0]
 [ 6 48  4  1  0  1  0  0]
 [ 1  4 40  6  0  1  1  0]
 [ 1  1  6 61  5  1  0  0]
 [ 0  0  0  5 30  3  0  0]
 [ 1  1  1  1  3 40  6  1]
 [ 0  0  1  0  0  6 55  7]
 [ 0  0  0  0  0  1  7 60]]
Each matrix is the tubeN-tubeM correlation. For for Bank1, the UPPER top plane, we see very few except for tube 2 and 3 (10 events), so I suspect a leak between those tubes. For Bank2, looks like tube 2 and 3 and 3 and 4, for Bank5 tube 6 and 7, and Bank6 looks pretty good. So what we have to do is take the thing apart and see if we can spot the leak (probably the black cladding got torn when shoving the tubes in the plastic frame, the fit is quite tight). If we stick with this method of cladding, we might need John to remake the frames slightly larger so it's easier to assemble.